

Paul Cretien examined the options price curve for six energy sector stocks to spot opportunities through price variances.
We examined the options price curve for six energy sector stocks using the Log Log Parabola Options Pricing Model in order to find the best options trading opportunities based on variance. The chart below shows call options on six Energy stocks: Valero (VLO), BP (BP), Royal Dutch Shell (RDS), Chevron (CVX), Exxon Mobil (XOM) and Philips 66 (PSX).
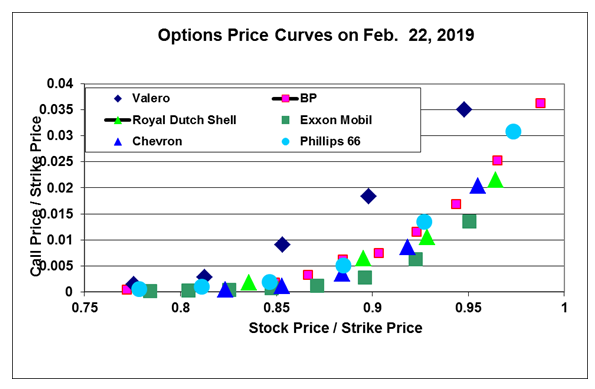
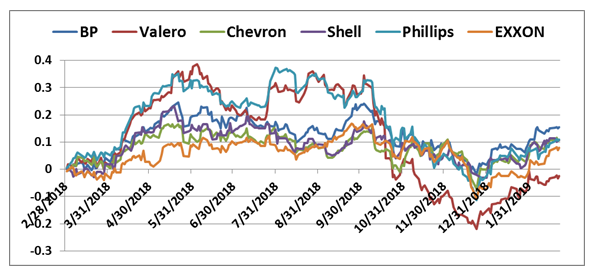
Five of the six are fairly tightly grouped around a central price curve. The one that stands out in terms of curve height – indicating that the options market considers it more volatile and therefore more valuable as an option – is Valero. Looking at the chart of percentage price changes over the past year on energy stocks (below), we can see that Valero has indeed shown exceptional volatility. At times, Valero has been a close pair with Phillips 66, and this may be something to look for in the future.
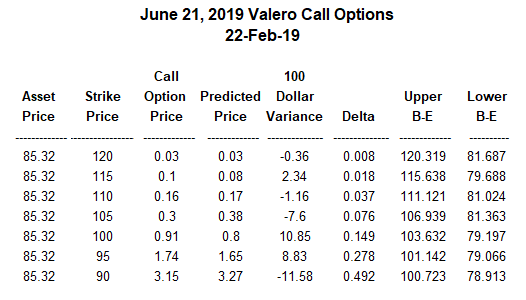
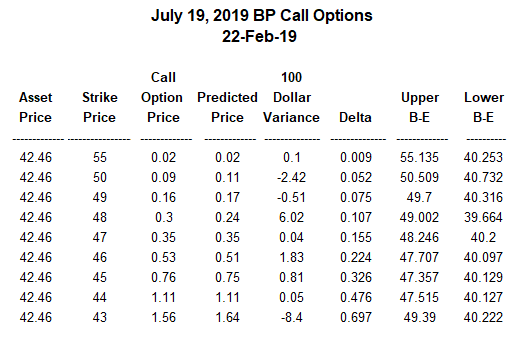
In an effort to find dollar price variances large enough to suggest buying or selling energy-related call options, the LLP pricing model was used to produce the price data for the six energy stocks (see tables below). For closing prices on Feb. 22, Valero calls with the June 21, 2019, expiration date show two variances exceeding $10 – probably sufficient to result in a short-term profit if the prices for strikes 90 and 100 return to the price curve. Several other larger variances included Exxon Mobil 62.50 strike with a variance of minus $24.77 (suggesting a buy), and Phillips 66 100 strike with a minus $19.33 variance, also a buy.
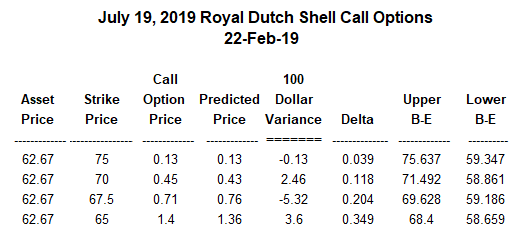
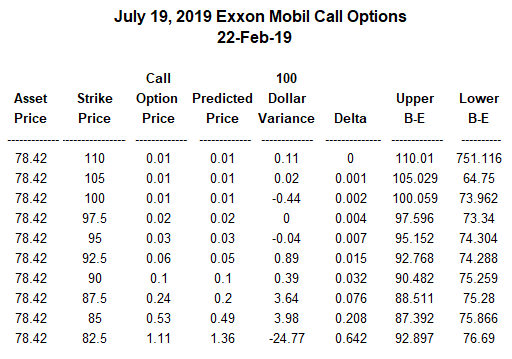
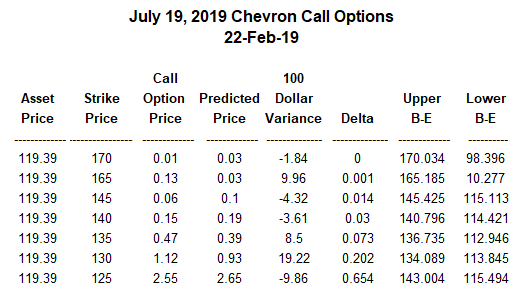
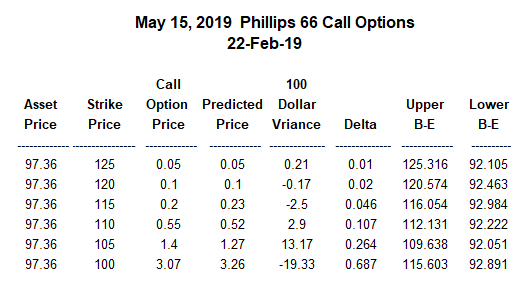
The LLP pricing shows that the market keeps energy call options close to the computed price curves, which makes observable price variances solid opportunities for reversion trades.


