
Rare E-mini S&P 500 edge top usually precedes a retracement, says Al Brooks.
The E-mini S&P 500 has a wedge rally on the daily chart that is testing the all-time high, though Friday provided a sell signal for a minor reversal.
The E-mini futures has a big bull bar in September so far (see chart). We have pointed out on several occasions that a bullish “OO” signal (outside down bar followed by an outside up bar) had been triggered when July went above the June high.
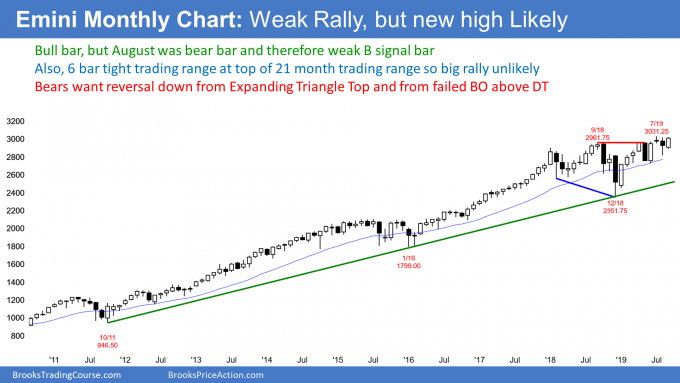
That meant that the E-mini was likely to go sideways to up for at least three months. September is the third month. If it closes near its high, October will probably go even higher.
There is no sign of a top. But if the bears get a reversal bar within the next few months, it would be a sell signal bar. Traders would see it as a second sell signal for the expanding triangle top that began with the January 2018 high. It would also be a second sell signal for a failed breakout above the double top.
The E-mini futures has rallied for three weeks from a higher low in August on the weekly chart (see below). This is the third leg up in the rally that began at Christmas. There is no sign of a top, so the odds favor sideways to up move over the next week.
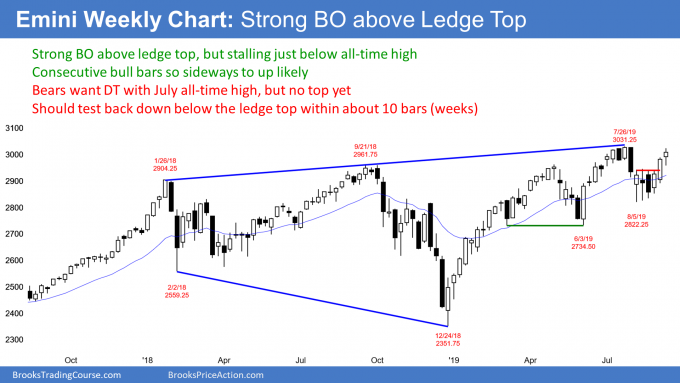
If the E-mini reverses down from above the July high, there would be a wedge top on the weekly chart. But a strong bull trend like this typically needs at least a micro double top before there will be a bear trend reversal. Consequently, the downside risk over the next few weeks is small. The E-mini would probably have to stop going up and begin to go sideways for at least three weeks before the bears could get a credible sell setup.
Since the August selloff that there would probably be a new all-time high this year. It most likely will come in September or October. The E-mini futures is testing the all-time high, which is apparent on the daily chart (see below. While the bears do not have a credible top, there are a three problems with this rally.
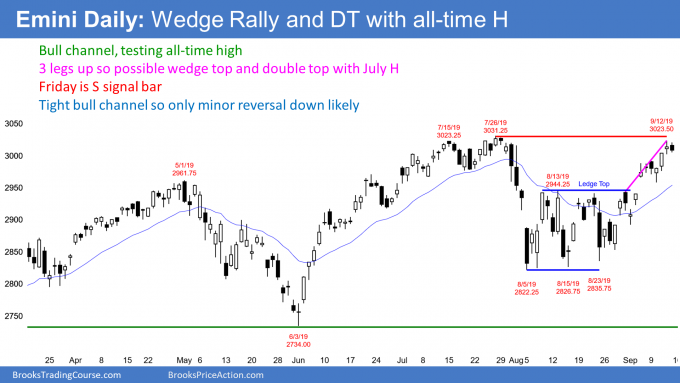
First, last week was the fourth leg up in the bull channel that began on Aug. 23. Three or more legs up in a bull channel is a wedge. Once there are three legs, the odds of profit-taking go up. Consequently, there is an increasing risk of at least a small pullback within a couple weeks.
Second, the gap above the August trading range was likely to have at least a small second leg up. This week was that second leg. However, the gap and this week’s rally were not strong enough to make a third leg up likely. Therefore, there is a 50% chance of a pullback within a couple weeks.
Breakout above ledge top so pullback likely
Finally, ledge tops typically have bull breakouts and then pullbacks. On Sept. 3, I said that the odds favored a breakout above the August trading range.
There were four highs in August at almost exactly the same price. This is easier to see on the weekly chart. When there are four or more bars with the same high, there is a ledge top.
Ledges on the daily and weekly charts are never perfect. But the closer to perfection they are, the more likely the market will behave as it does with a ledge. This ledge is as close to perfect as you are going to see.
On a five-minute chart, a ledge top has four highs that are identical to the tick. There would then be an 80% chance of a bull breakout.
Ledge tops are much less common on weekly charts. But markets are fractal. This means they behave the same on all time frames. Therefore, the odds favored the bull breakout.
However, there is one other interesting characteristic of ledge tops. The top of the ledge is an important price. When the E-mini is below it, traders expect a rally to at least a little above the ledge.
But the top of the ledge remains a magnet even after the bull breakout. On a five-minute chart, there is an 80% chance of a pullback below the top of the ledge by the end of the next day. Most of the time, the pullback begins within 20 bars.
Since ledges are rare on the daily and weekly charts, the sample size is small. This makes it is impossible to know exactly how likely the pullback is. But it is reasonable to assume that there will be a pullback to below the top of the ledge within about 20 days. That means by the end of October.
Trading Room
Traders can see the end of the day bar-by-bar price action report by signing up for free at BrooksPriceAction.com. I talk about the detailed E-mini price action real-time throughout the day in the BrooksPriceAction.com trading room. We offer a two-day free trial.


