

The monthly chart for the 30-year U.S. Treasury bond is forming a major top, writes Al Brooks.
The monthly chart for the 30-year U.S. Treasury bond is forming a major top, but there will probably be a trading range over the next year.
The 30-year Treasury bond futures formed an inside-inside (II) sell signal on the monthly chart in October (see below). An inside bar is a bar with a low at or above the low of the prior bar and a high at or below the high of that bar. An II pattern is present when there are consecutive inside bars, like October and September.
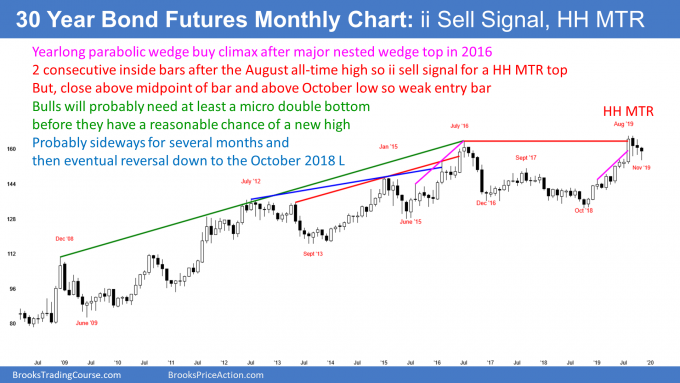
When November traded below the October low, it triggered the monthly II sell signal. But both bars in the II had prominent tails. That means traders bought near the lows of those months.
That also means that the II is a weaker topping pattern. November is consistent with this. It sold off early in the month to a couple points below the October low. But it then reversed up to above the October low.
That is not what the bears want. They want lower prices. The chance of them getting lower prices would have been higher if November closed on its low and far below the October low. Instead, it close above its midpoint and above the October low. It is a weak entry bar for the bears.
This buy climax top is coming after an extremely strong rally in 2019. Strong bull trends do not typically instantly reverse into bear trends. They usually have to transition into a trading range first.
That is what is likely over the next several months and possibly all of 2020. Traders should expect the bond market to be mostly sideways for many bars.
Nested wedge top
I have been writing for several years about the nested wedge top on the monthly chart. Unless bonds break far above that top, that top should be the approximate end of the 30-year bull trend. This year went above the wedge top, but only briefly in August. The 2019 rally was a parabolic wedge buy climax. This reversal down is another attempt to end the 30-year bull trend.
I have been saying that the transition into a 20-year bear trend might take many years. That process is still underway.
I also have said that the United States will not allow negative interest rates. That will therefore put a cap on bond prices. Traders should not expect significantly higher bond prices from here.
While ultimately bonds will go much lower, they might continue sideways for a few years first. There is no sign of an imminent selloff. Traders will probably see a big trading range in 2020.
Trading Room
Traders can see the end of the day bar-by-bar price action report by signing up for free at BrooksPriceAction.com. I talk about the detailed E-mini price action real-time throughout the day in the BrooksPriceAction.com trading room. We offer a two-day free trial.


