

Coronavirus fears tanked U.S. stocks this week. As of this writing (Thursday pre-open), the S&P 500 Index is down more than 14% from its Feb. 19 high. This is one of the worst weeks in market history so far.
In retrospect there was a warning of trouble in the form of a negative divergence between SPY and its slow (19-39 day) MACD: SPY made a new high on Feb. 19 but MACD never revisited its January high. MACD generated a sell signal on Feb. 24. (See chart below.) The advance-decline line itself did not provide any early warnings. On Feb. 27 SPY fell to the area of its 200-day moving average, now at 304.
The historical precedent of our newsletter timing model suggests that further potential losses in the S&P 500 should be limited to approximately 7% from the Feb. 27 close until its next sell signal. However, we did begin reducing equity positions for client accounts before a formal sell signal because the market’s behavior in this correction could be without precedent.
An op-ed in a recent issue of the Wall Street Journal noted that the current decline is about as large as that following other post-WWII pandemics. However, it appears that we are at greater risk now than in the past because this virus may be harder to contain, and the world is more vulnerable to economic disruption by virtue of being more interconnected. (The paradoxical problem with the current Coronavirus is that many of those infected don’t get seriously ill, which means that they can spread the disease with realizing it.)
Subjectively, this feels to me more like the period after 9/11. In retrospect, the damage from the terrorist attacks on those days was contained but at the time, nobody knew what to expect. The S&P 500 Index lost 11.6% in the nine trading days between Sept. 10, 2011, and Sept. 21, 2011 (circled in the chart to below).
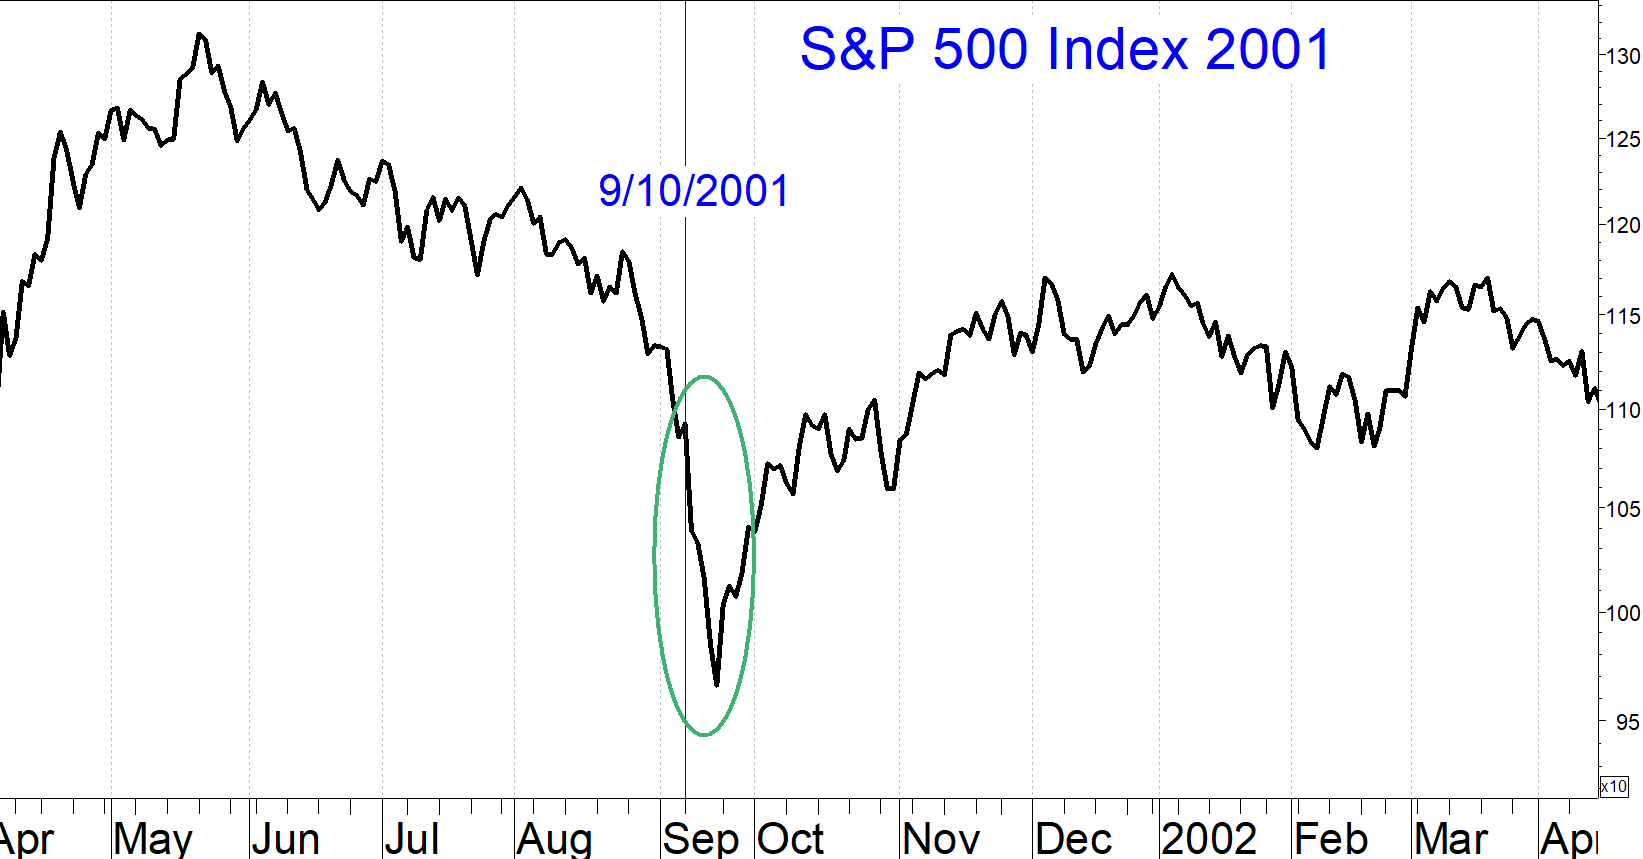
Of course, the analogy is not exact. The 9/11 terrorist attack capped off a 26% market sell-off that began in May whereas the current sell-off came out of the blue off of an all-time high. The 2001 sell-off occurred at the tail end of a recession, while this decline began at an economic peak and may therefore extend longer as the negative economic impact unfolds.
My guess is that stocks are discounting a recession. Historical market declines in the setting of recessions have been 25%, which is a plausible downside objective for the current sell-off.
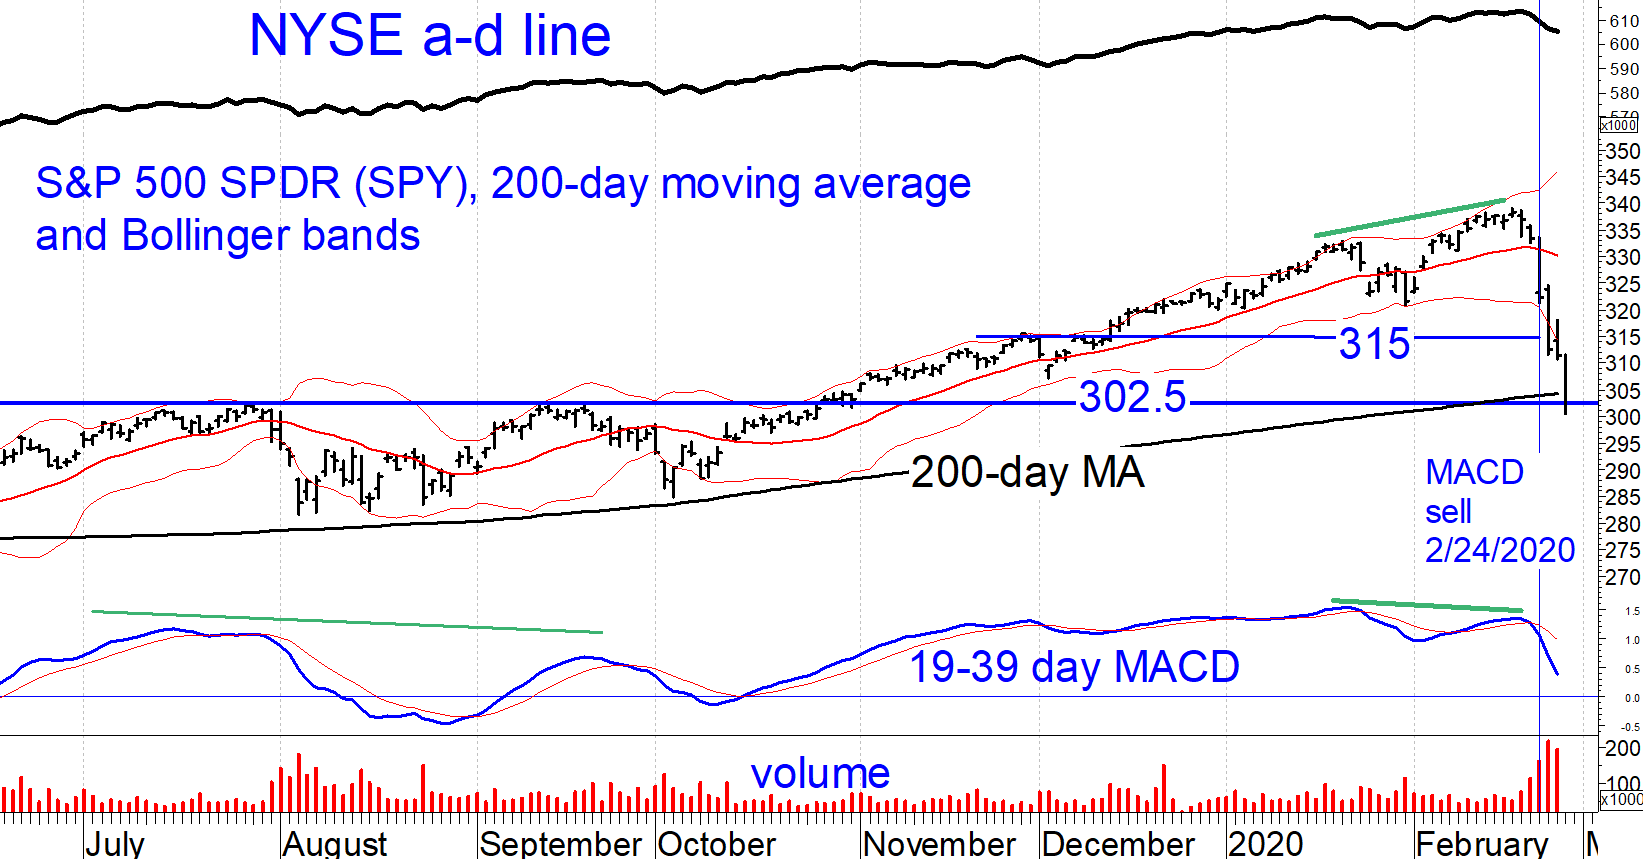
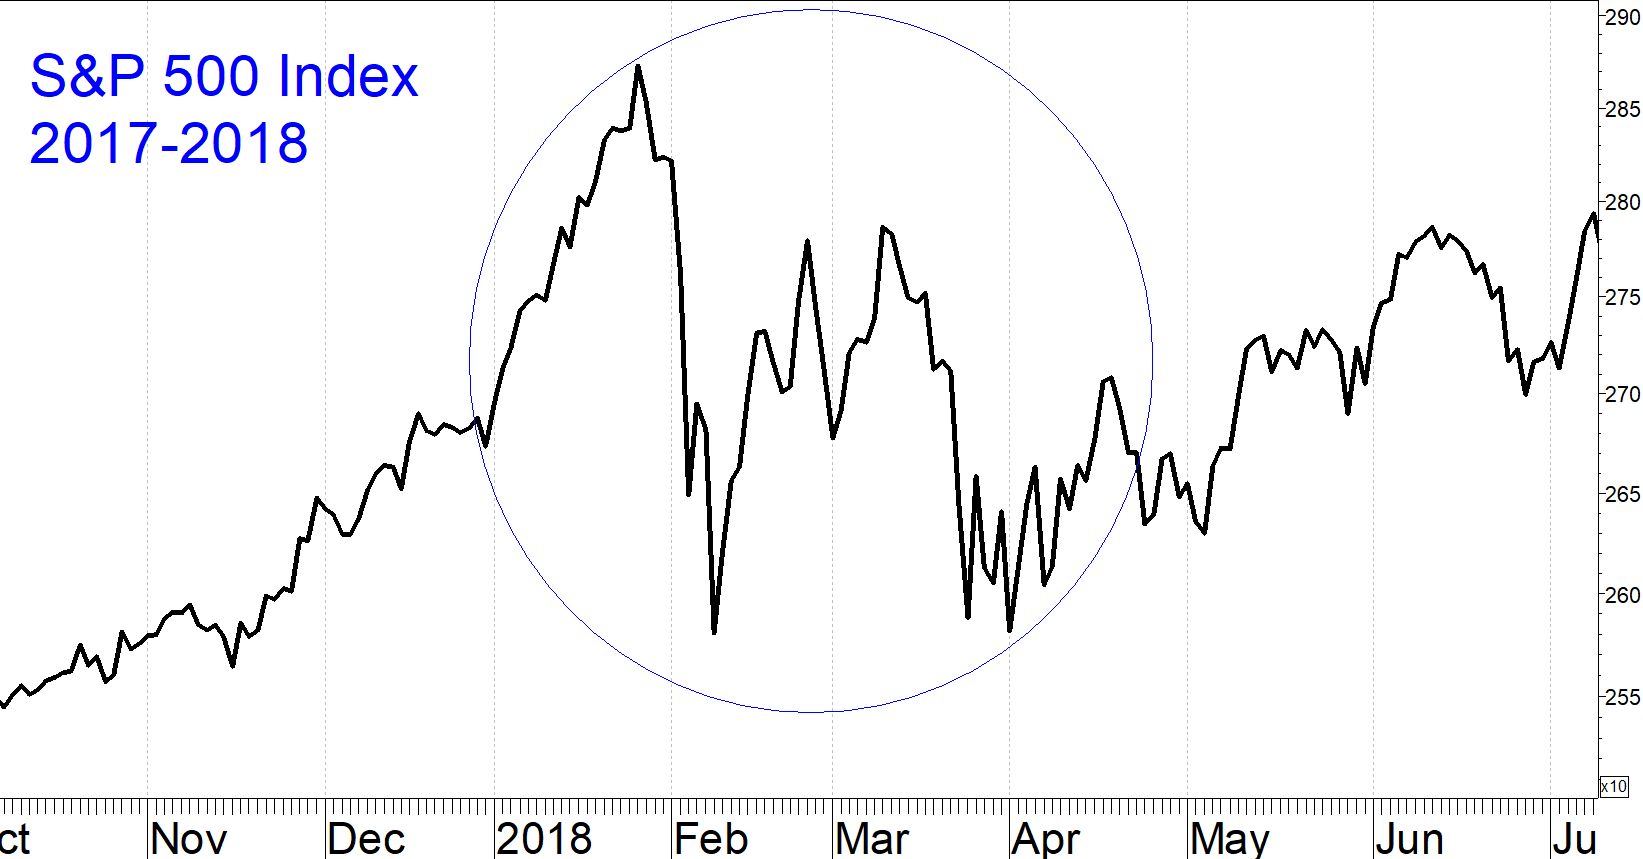
The chart shows that back in August and October, this moving average was a support area. The 200-day average is close to another potential support area defined by the July and September highs around 302.5, increasing the likelihood that the sell-off stalls near here. I expect the 200-day average to hold as support again, but only temporarily. At the very least, even if the market forms a low in the area of the 200-day moving average, we should see a retest of this area. In the last issue, I suggested an analogy between this past week and the 10% market correction in Jan.-Feb. 2018. The S&P 500 index retested its Feb. 8, 2018 low on March 23 and April 2, 2018 (circled in chart below).
Implications
We came into Feb. 27 with our moderate-growth client accounts having below-allocated risk exposure, moving at roughly half the volatility of the S&P 500 Index. Even though our model remains on a buy, and even though the 302-304 area for SPY was expected to be a support zone, I recommend steadily reducing your equity exposure to about half your usual allocation immediately. With the Coronavirus we are in uncharted territory, so caution is warranted. We do have indicators that have done a good job of recognizing major market bottoms. When these flash re-entry signals, we will let you know.
Sign up here for a free three-month subscription to Dr. Marvin Appel’s Systems and Forecasts newsletter, published every other week with hotline access to the most current commentary. No further obligation.


