

John Rawlins sees weakness in the Nasdaq based on his QuantCycles Oscillator.
Recently we have seen the technology sector outperform the broad stock market. In fact, the Nasdaq Composite Index (COMP) set all-time highs while the S&P 500 and Dow Jones Index are both still well off their all-time highs.
We decided to see what the QuantCycles Oscillator is indicating regarding the Nasdaq Composite.
It has been on quite a run, but the QuantCycles Oscillator indicates a downturn in the Nasdaq over the next several weeks (see chart below).
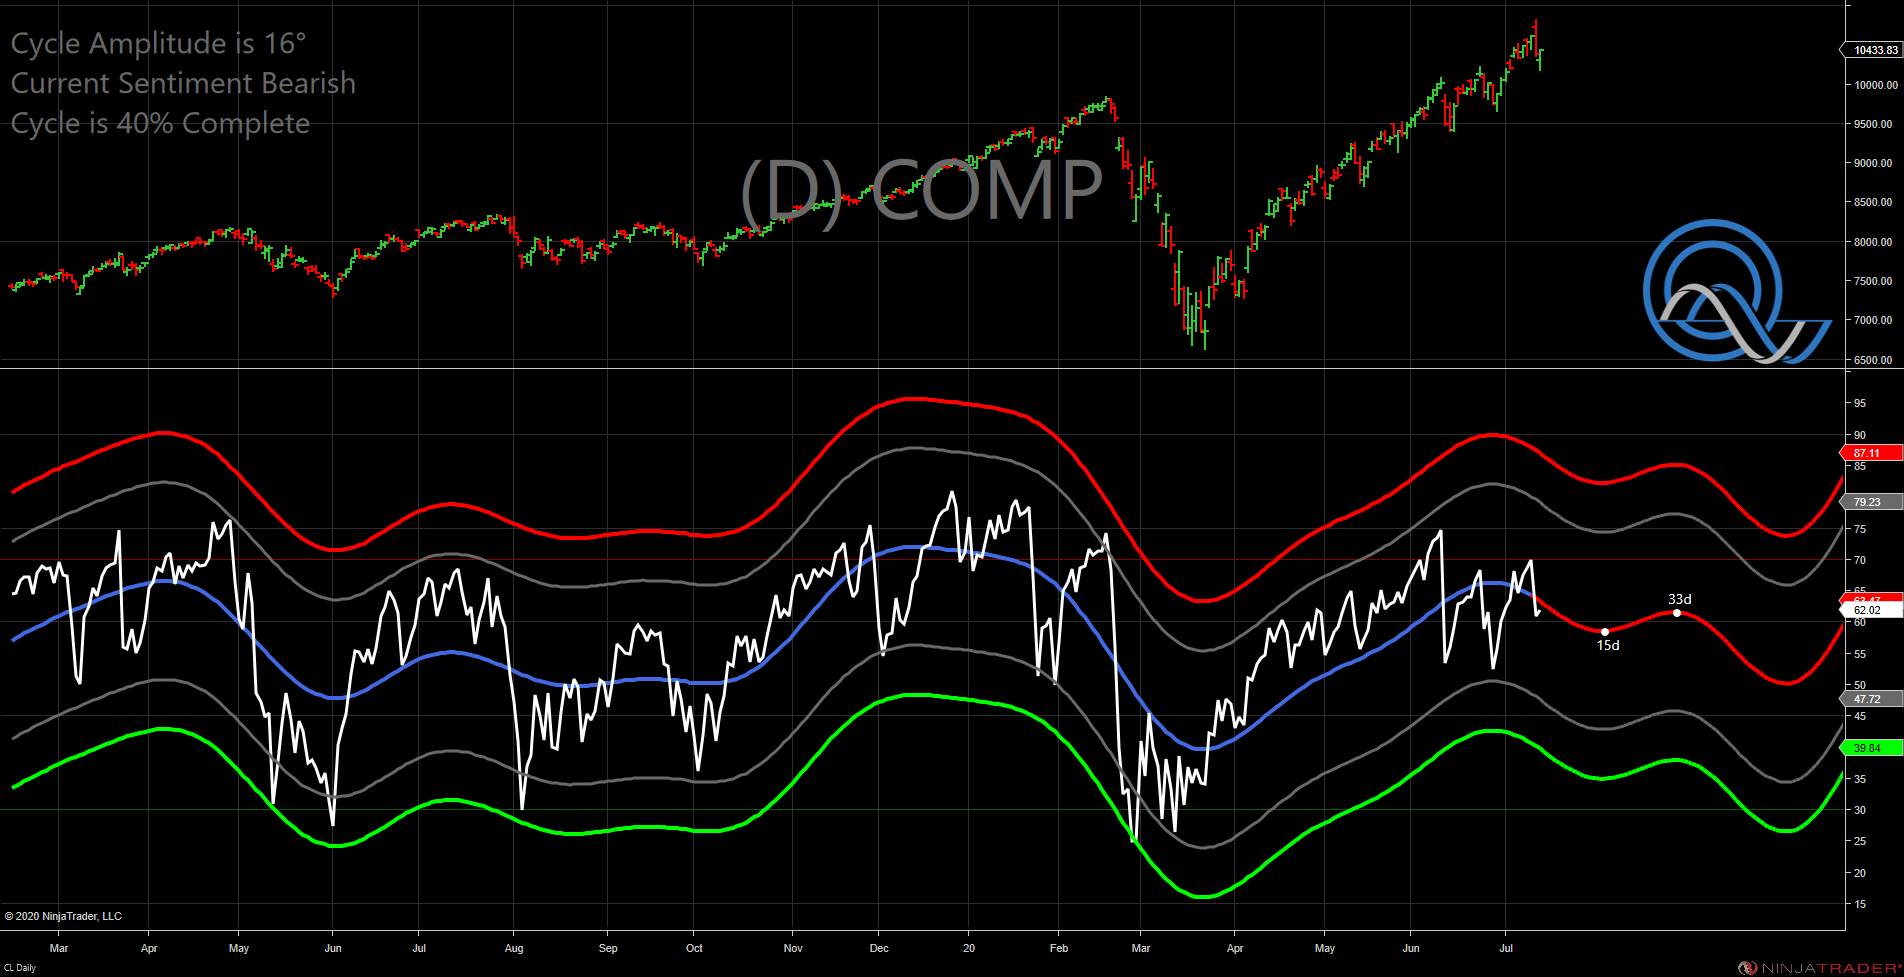
The rebound, which came off of extreme oversold conditions, was substantial, but the oscillator had the COMP topping out last week.
Looking at the longer term picture shows a much bleaker outlook for the DOMP through Halloween (see chart below).
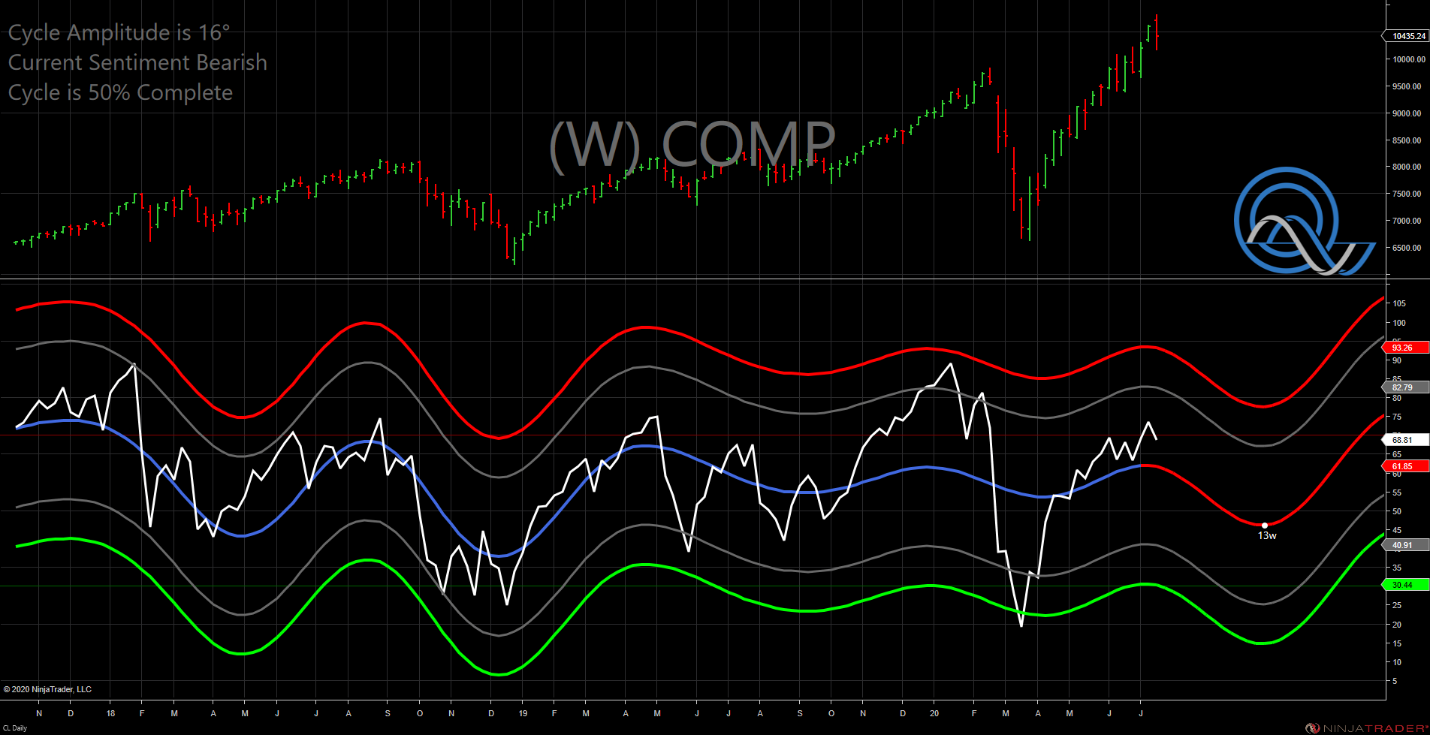
As you can see, the oscillator has the Nasdaq just topping out followed by a sharp 13-week decline.
The one fly in the ointment of this bearish outlook is, despite the Nasdaq impressive rally over the last several months, it has not reached overbought territory in the oscillator.
Let’s take an even wider view and look at the monthly QuantCycles Oscillator for the Dow (see chart below).
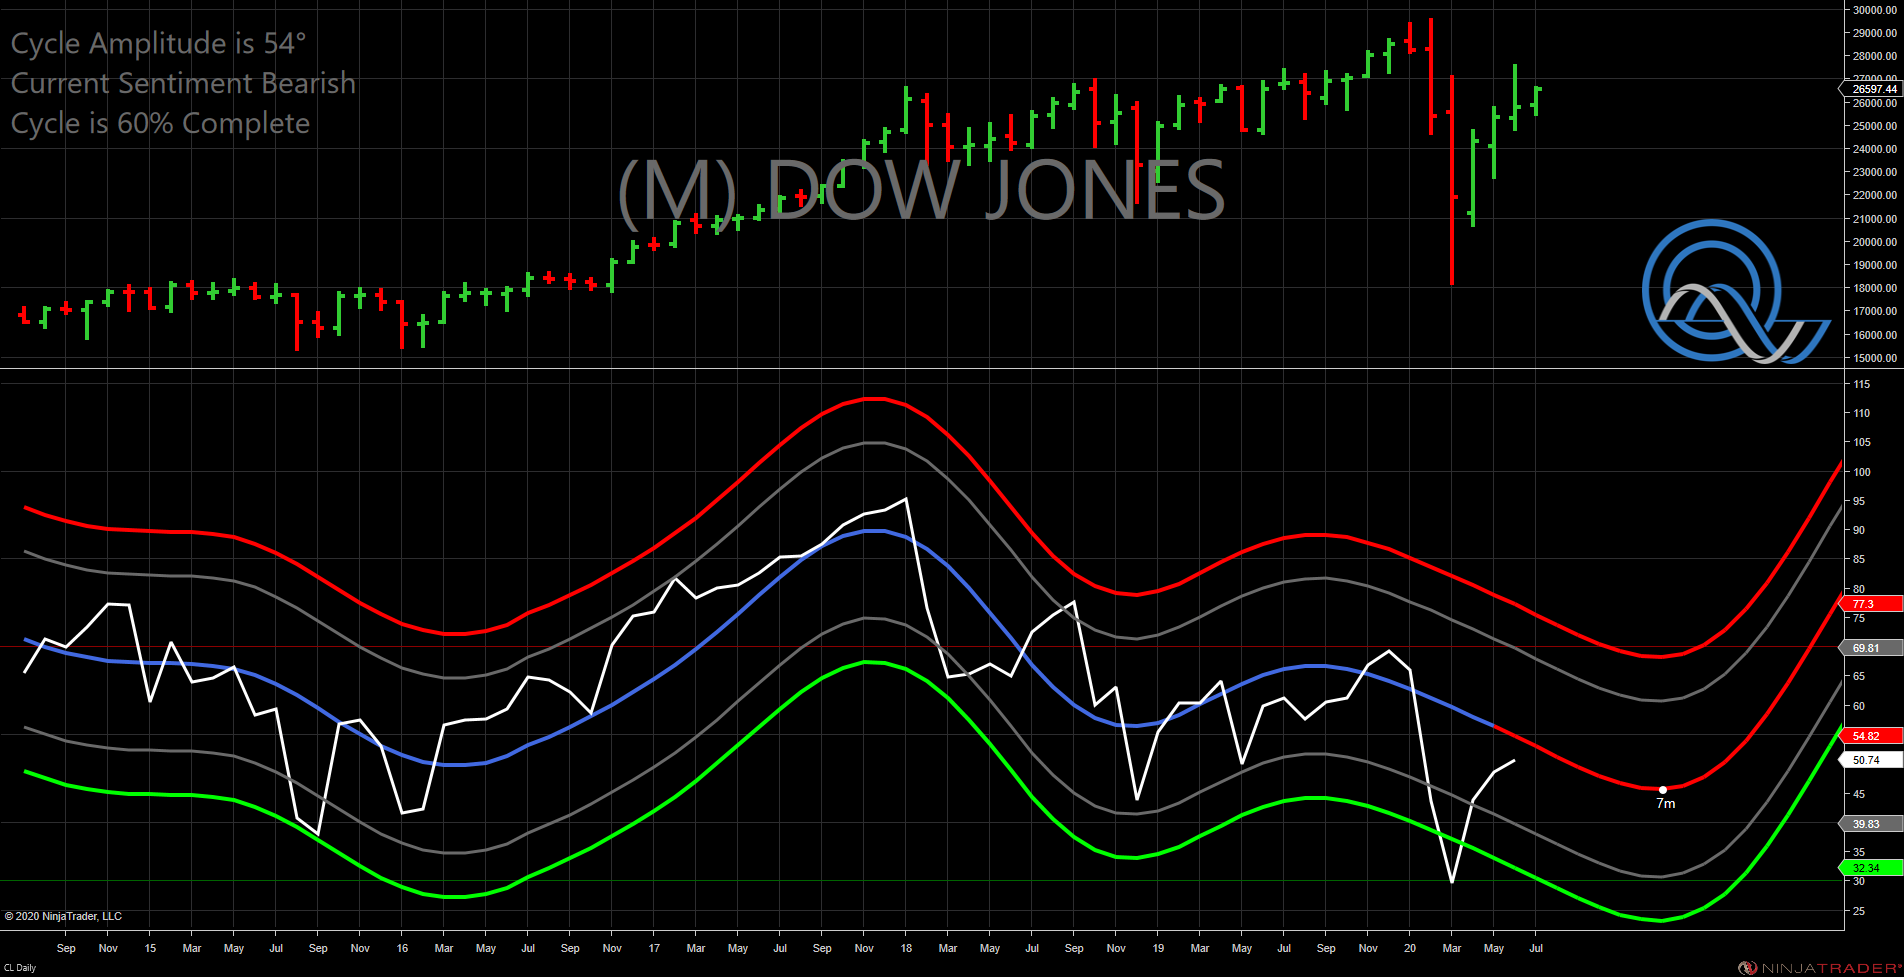
This clearly shows a long-term bearish outlook beginning at the start of 2020. this year. The rebound began after oscillator moved into extreme oversold territory, but it clearly shows a bearish outlook for the remainder of the year.
While timing is always an issue, it may be time to take and or protect profits, particularly in the tech heavy Nasdaq.
John Rawlins described the value of the QuantCycles Oscillator recently at The Orlando MoneyShow.
The QuantCycles indicator is a technical tool that employs proprietary statistical techniques and complex algorithms to filter multiple cycles from historical data, combines them to obtain cyclical information from price data and then gives a graphical representation of their predictive behavior (center line forecast). Other proprietary frequency techniques are then employed to obtain the cycles embedded in the prices. The upper and lower bands of the oscillator represent a two-standard deviation move from the predictive price band and are indicative of extreme overbought/oversold conditions.


