

Gold does not always behave and is due a correction regardless of where stocks move, some analysts project, notes Avi Gilburt.
We are approaching an inflection point in gold.
I am quite disappointed at what I am reading publicly about gold. Many are still trying to sell you on the fact that gold is a hedge against market volatility. They suggest that you need to own gold to protect your portfolio when the stock market tanks. I have noted that history simply does not support this perspective.
There have been many periods when gold has rallied alongside the market, such as 2002-2007, and there have been times when gold has tanked alongside the market, such as in 2008. In fact, with 2008 being the most deflationary period of time we have experienced since the Great Depression, how much protection did gold provide to you during the time you most needed it?
Just look at how it has been mirroring the action seen in the stock market for 2020, if you are not yet convinced about the fallacy noted above.
Now, I am not claiming that gold will or will not “protect” you during times of volatility. I am simply saying it is not as simple as many claim it to be. Rather, those claims are not factually accurate. Most often, those claims are intended to sell you something based upon fear.
Instead, you should be analyzing gold on its own to know when it is the appropriate time to buy and sell the yellow metal. That is what we have done for years.
For those following my work over the last year on the SPDR Gold Shares ETF (GLD), I was strongly urging you to buy gold around Thanksgiving time of 2019. At the time, GLD was around 136. Then in February of 2020, when GLD was around 160, I was expecting a pullback, for which I was primarily targeting the 149 region. But, clearly, GLD broke that support and dropped to our next lower support region of 136 again. Yet, the structure was corrective in nature, which kept me bullish gold in the longer term.
Now we are approaching the 170-175 GLD target I outlined last year as my main target for 2020. As we are approaching that target region, we set last year, I am expecting a pullback.
Initial support for this pullback is in the 161-65 GLD region, with further support below that in the 141-148 region (see chart below). The manner in which the market pulls back in the coming weeks will give us greater clarity regarding the depth of the impending pullback. Once we see a sustained break of 167/168 GLD, then the pullback is likely in progress.
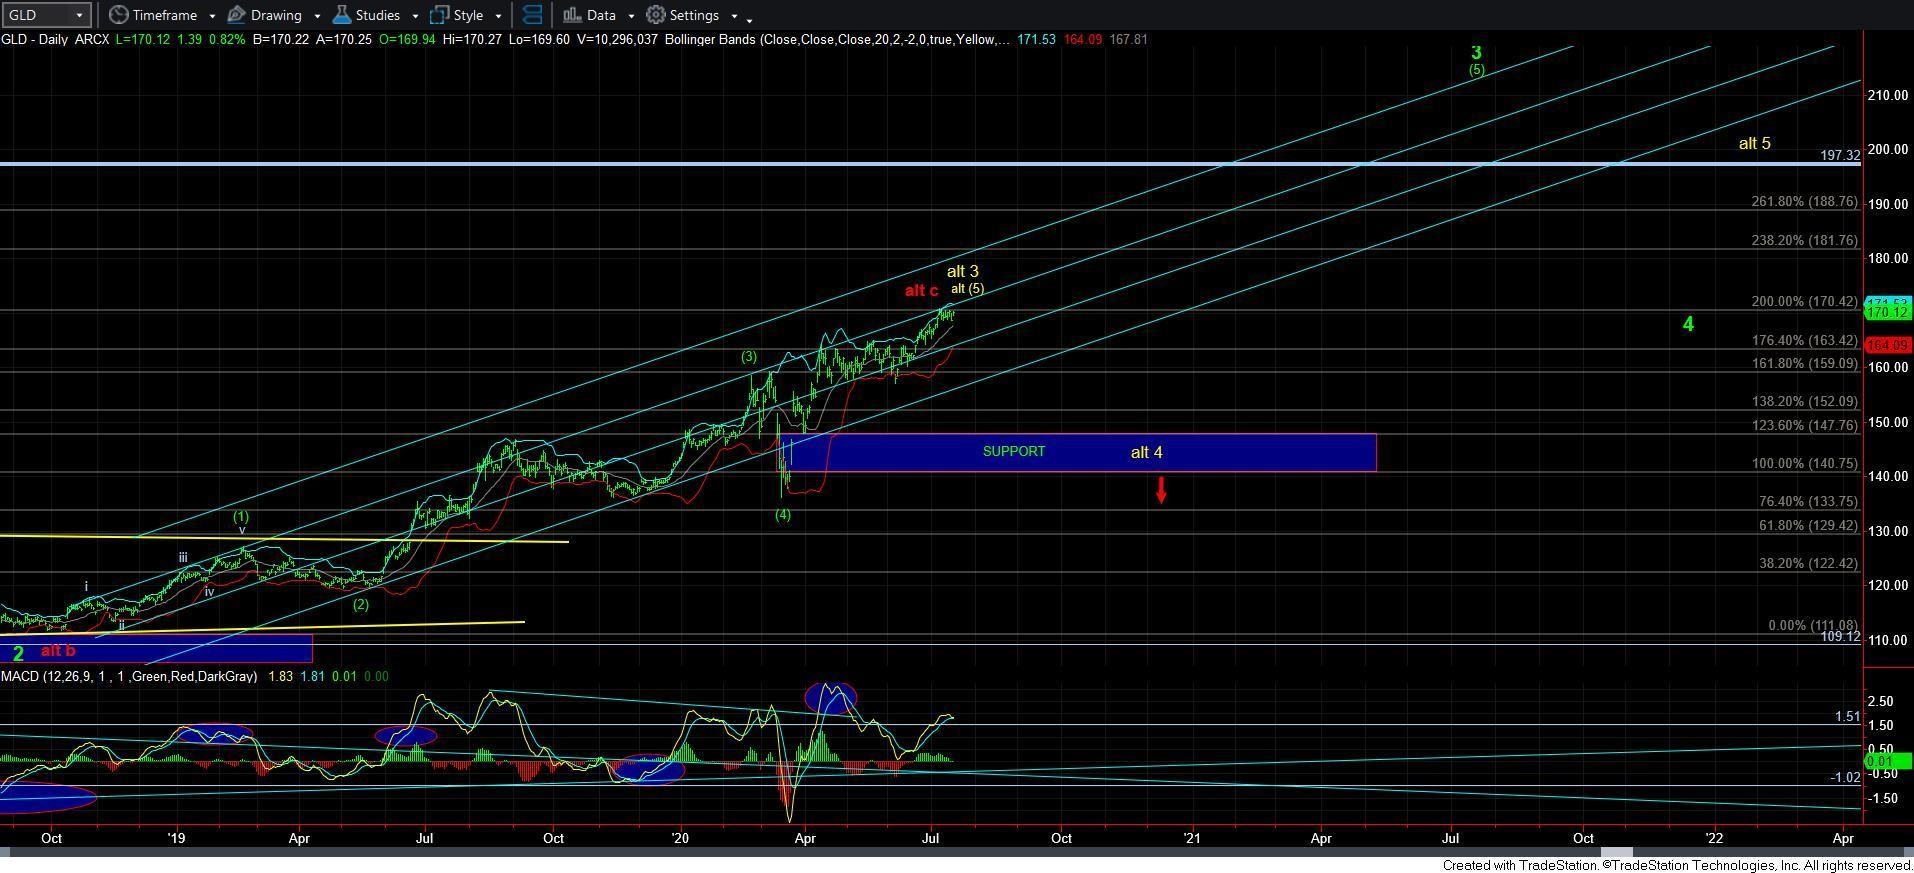
Moreover, depending upon the depth of the impending pullback, the next minimum upside target is the 188-197 region. Once the next upside structure develops, then we can hone in on the more likely target within that region.
The only thing that would invalidate the potential for the next higher target region is a break down below 141, which would suggest that we will break below the low struck in late 2015. For now, that is clearly not my expectation. But, as we are now approaching an important inflection point for gold, I thought it was an appropriate time for me to present a warning to those that follow my analysis in order for you to be able to protect your positions.


