The reversal of the long-term bear channel in the euro is experiencing a buy climax and could be ready to correct, reports Al Brooks.
The EURUSD currency pair is showing a nested wedge buy climax. Traders should expect a two-week pullback to begin soon.
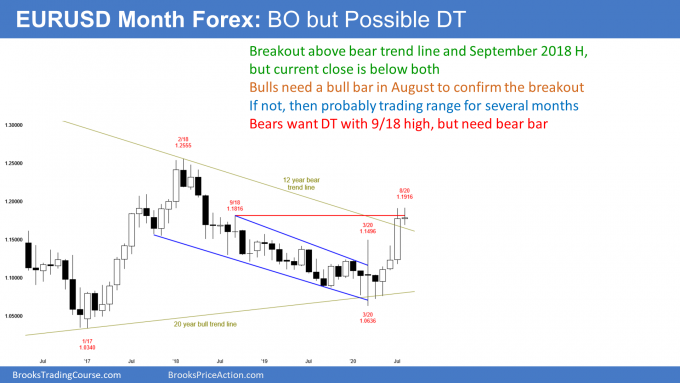
The EURUSD currency pair had a big bull bar in July that broke above the top of the two-year bear channel on its monthly chart (see below). It also broke above the September 2018 high. That was the start of the bear channel, which followed the strong reversal down in April and May 2018 (the spike down in the two-year Spike and Channel Bear Trend).

However, July closed below both resistance levels. Also, once there is a reversal up from a Spike and Channel Bear Trend, traders look for a test of the start of the channel (here, the September 2018 high) and then a transition into a trading range.
The bulls quickly retraced two years of selling. Traders are wondering if this strong reversal up will continue up to the February high. That was the start of the 30-month bear trend. While it is possible, that is not what typically happens. Usually the market stalls once it reaches the start of the bear channel. Since the EURUSD is there now, there is an increased chance of at least two to three weeks of sideways to down trading starting soon.
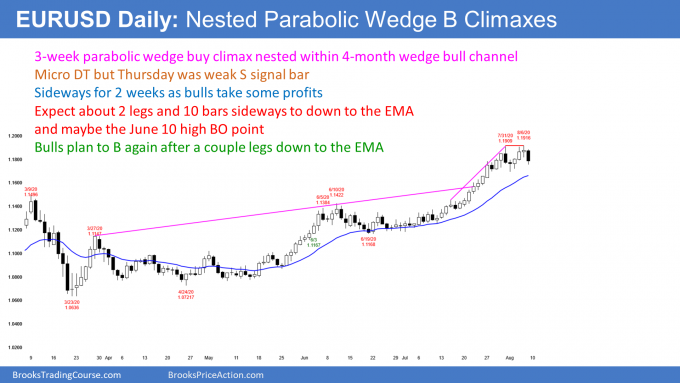
The EURUSD daily chart has a nested wedge buy climax
The daily chart rallied in a parabolic wedge buy climax over the past three weeks (see below). That rally was the third leg up of a bigger wedge bull channel that began in March.

There is now a micro double top. But Thursday was the sell signal bar and it was only a bull doji. That reduces the chance that a move down began on Friday. The daily chart might have to go sideways for a few days before it can go down.
A nested wedge is more likely to reverse. When a wedge reverses, there are several minimum goals. First, traders expect about 10 bars and two legs sideways to down. Next, they expect a test of support, like the 20-day exponential moving average and the breakout points. The rally broke above the March 9 and June 10 highs. Those breakout points are therefore magnets below.
Also, a wedge often reverses down to the bottom of the most recent leg up. That is either they July 16 or the June 19 low.
Finally, traders look for a retracement of a third to a half of the rally.
This all presupposes that the bulls are exhausted and will take profits starting within a week or two. That probably will happen, but with the rally as strong as it has been, there is a 40% chance that it will continue up to the February 2018 high without more than a two- to three-week pullback.
Trading Room
Traders can see the end of the day bar-by-bar price action report by signing up for free at BrooksPriceAction.com. I talk about the detailed E-mini price action real-time throughout the day in the BrooksPriceAction.com trading room. We offer a two-day free trial.


