

Al Brooks breaks down technicals in the euro as the forex market should eventually test the September 2018 high and then enter a trading range.
The EURUSD Forex weekly chart has a micro wedge nested in a five-month wedge at resistance. Traders should expect a pullback to the June 10 high.
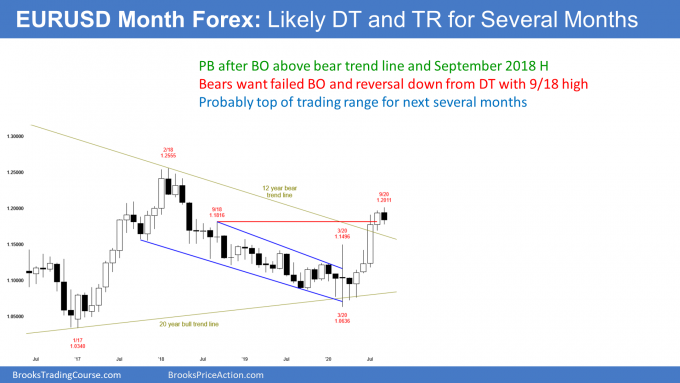
The EURUSD Forex monthly chart had a bull breakout in July, and August was a bull follow-through bar (see below). That combination makes it likely September would trade above the August high, which it did this week.
However, for several months I have been saying that the EURUSD Forex market should eventually test the September 2018 high and then enter a trading range. That is still true. Therefore, as strong as the 4 month rally has been, it should stall here for at least a couple of months. At a minimum, traders should expect a pullback to the March high, which was the breakout point for the July breakout.
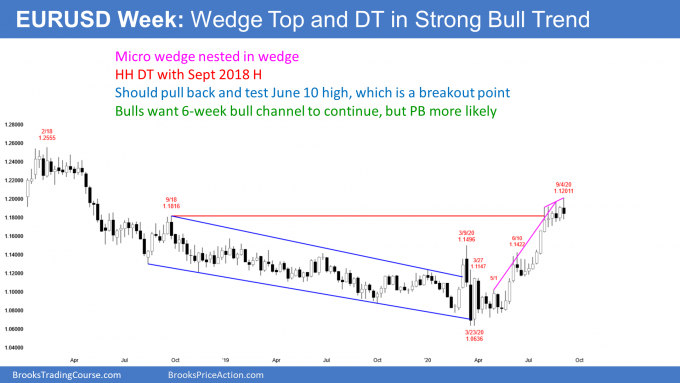
The EURUSD weekly chart rallied strongly, but it has stalled for six weeks at the September 2018 high (see below). Since the rally from the March low has had 3 legs up in a tight bull channel, it is a parabolic buy climax.
That typically leads to a couple legs sideways to down to support. Obvious support is at the two breakout points, the March 9 and the June 10 highs. That means traders should expect a 500 pip pullback over the next couple months.
This week was a bear bar. It is a sell signal bar for a nested wedge buy climax at resistance. However, it had prominent tails above and below and it is in a 6 week tight trading range. It is therefore a weak sell setup.
The past 5 weeks formed a micro wedge top. That wedge is nested within the bigger wedge that began with the March low. Traders should expect lower prices for about 10 bars, which is about a couple months. However, the EURUSD has been sideways for 6 weeks and it might continue sideways longer before it begins to test down.
Can the strong bull trend keep going up to the February 2018 top at around 1.2500? The bulls currently have a 30% chance of that. Sideways to down is more likely.
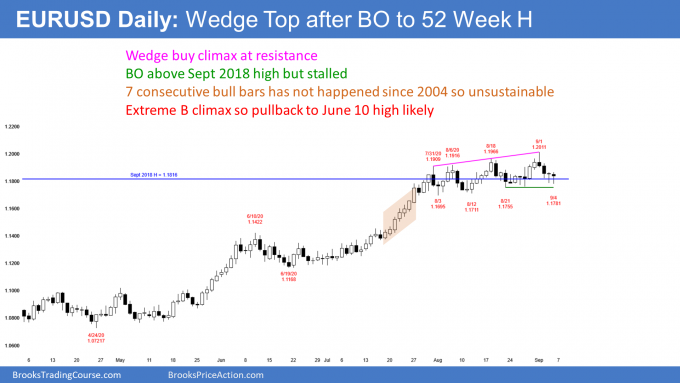
The EURUSD daily chart has been in a weak bull channel for a month (see below). It is basically a trading range that is tilted up. There were three pushes up to the August 18 high, and the pattern was therefore a wedge.
This week broke above the 3rd top and reversed down. Some will call that a failed breakout above a wedge, which is a sell signal. Others will say that it was a wedge with 4 legs up instead of 3. Both are correct.
What matters is that the bulls continue to fail to break far above the resistance of the September 2018 high. As a general rule, if the market keeps trying to do something and fails, it will probably then try to do the opposite.
While the daily chart is still in a six-week trading range, the odds are slightly better for a bear breakout. However, a couple closes above this week’s high will flip the odds back in favor of the bulls.
The reversal down so far has not been strong. But a reversal down from a wedge top typically has at least 2 small legs. Consequently, if there is a bounce over the next few days, it will probably form a lower high.
But will the bears get a couple closes below the August 3 low at the bottom of the range? We don’t know yet, but if they do, traders will conclude that a swing down has begun. They will look for a test of the June 10 high breakout point and possibly the June 19 start of the June/July buy climax.
Trading Room
Traders can see the end of the day bar-by-bar price action report by signing up for free at BrooksPriceAction.com. I talk about the detailed E-mini price action real-time throughout the day in the BrooksPriceAction.com trading room. We offer a two-day free trial.


