

Stocks took a beating for a good part of last week, but the market’s breadth as measured by the New York Stock Exchange Advance Decline line (NYAD) recovered and the uptrend, although slightly weakened, is still intact, states Joe Duarte of In the Money Options.
Moreover, last week’s spike in volatility seems to have calmed down to some degree, a fact that may give traders a bit of breathing room and allow the upside to re-establish itself.
In addition, because I’m seeing a lot of amazing price charts and bullish directional movement in the options of a good number of stocks outside of the mainstream, I’m going to stick my neck out and suggest that we are seeing a rotation out of the larger stocks and into smaller and midcap niche stocks, which is where I’m starting to put some money.
Nevertheless, I’m still cautious because options expiration data from the week ending on 5/14/21 suggests that the 415-420 strike price areas for SPY still hold the key for the market. That means that if put buyers and stock sellers take over again, we could see an acceleration of the selling. Thus, a sustained and well-supported break above 420 on SPY is likely to lead to higher prices. Meanwhile, a failure at 420 and a break below 415 will likely lead to resumption of the down trend.
So, these are still the key operating points of the moment:
- If the Fed even hints at higher interest rates, the bull market may be in serious danger quickly
- Supply chains in technology, lumber, jobs, gasoline, and perhaps even produce as West Coast droughts intensify will be relevant in the coming months even to the algos as the news will eventually increase on these fronts
- Intraday volatility is still likely to remain as the options market and the news cycle continues to influence the stock market
- Watch out for a resurgence in put buying at key strike prices on SPY
- Tests of support and resistance may still be likely on a regular basis leading to frustrating trading as we saw last week
- Selectivity in stocks will be extremely important as money rotates and there will also be the need to be patient and to be nimble
- Risk management will remain a key and will likely require an increase in options trading
Put Buyers Got Only Temporary Revenge for Now
During the week that ended on Friday 5/7/21, which culminated in the market rally following the jobs report the call buyers came in and finally took out the 420 area on SPY, which quickly evaporated by Monday as support as the buying assault for the call buyers at the 420-425 strike failed miserably. In fact, their utter failure at holding prices above 420 on SPY set up last week’s temporary bear raid as put buyers gained a foothold and the market rolled over.
Indeed, the Monday and Wednesday weekly options expirations for the SPDR S&P 500 ETF (SPY) for the week that ended on 5/14 were decidedly bearish as put buyers built on their advantage and support levels gave way easily as algos who sold puts to meet retail put buyer demand were forced to sell stocks and stock index futures to hedge. However, volume was noticeably lighter on both sides of the options ledger during the rout, often a sign that the prevalent trend may be temporary.
And that’s what happened as call buyers came back in force on Thursday and Friday as the major indexes and the NYAD, as I describe below found support.
It’s important to recall that when call buyers force dealers to hedge their call option sales via stock and stock index futures purchases stocks tend to rise. In contrast, as we saw last week, when put buyers forced dealers to sell puts, dealers must then hedge their bets by selling stocks and selling index futures, which drives stock prices lower. The bottom line is that the options market, specifically weekly expirations on SPY continue to exert a credible influence on the overall stock market.
And if you want more in depth options analysis that you can put to use in your daily trading you can catch me live and in person at The Money Show in Orlando in June. Register here.
Gilead Sciences Delivers Mysterious Breakout for those Who Can See Beyond the COVID Fog
Shares of biotech antiviral giant Gilead Sciences (GILD) broke out to a new ten-month high just as the stock market was rolling over, a sign of relative strength and a bit of a head scratcher unless you dig a little deeper.
Gilead is one of those biotech companies that makes money hand over fist on a regular basis as its anti-HIV meds own a significant portion of the market. More recently, its anti-Covid drug Remdesivir turned into a short-term cash cow as global governments poured big bucks into the drug. But the market failed to see the merits of Remdesivir as both studies and real-time clinical results were fair at best. As a result, the stock lingered near its 52-week lows since August 2020. But due to COVID-19 the company’s HIV and hepatitis sales have slumped so it delivered a mixed earnings report, and the stock took yet another beating before embarking on a rally, which has taken the stock to the key resistance area near $70.
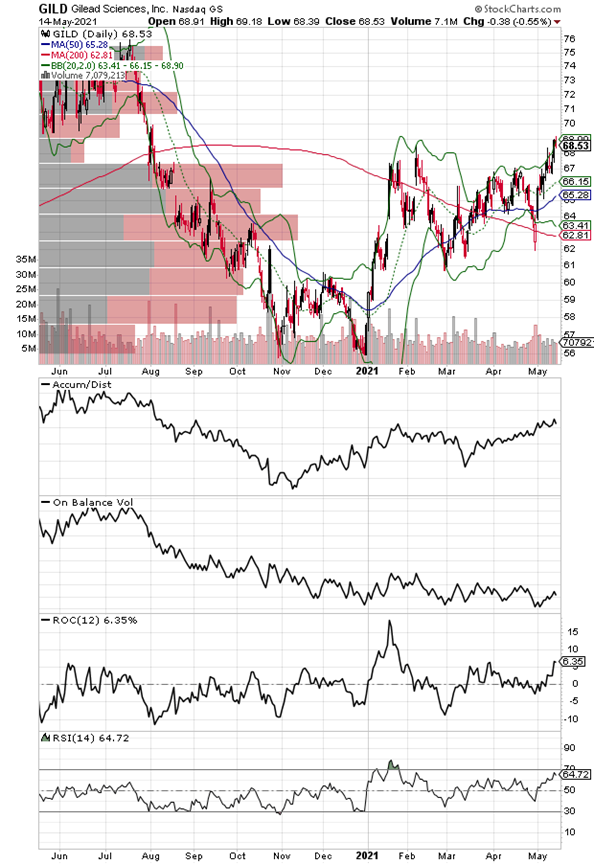
Still, over the last two to three weeks, the stock has been under heavy accumulation, and it recently scored a short-term breakout on heavy volume, which was confirmed by On-Balance Volume (OBV) and Accumulation Distribution (ADI). In fact, the stock has been trying to bottom since the March-April time frame when the FDA granted full approval to the company’s breast cancer drug Trodelvy to be used in cases of advanced local or metastatic disease, which has failed other therapies. Besides that, the stock has a 4.3% yield and goes ex-dividend on June 14.
Going through the most recent earnings call was like plowing through a thick word swamp full of hard to pronounce antiviral drugs with asterisks everywhere and an alphabet soup of in progress clinical trials and potential milestones. Nevertheless, the take home message seems to be that as the market is focusing on Remdesivir, the company is actually making big inroads into its three more reliable areas, HIV and hepatitis—both B and C, as well as expanding into cancer treatments with emphasis on both breast and blood and bone related cancers. Moreover, it is finding success in these areas and has several potential billion-dollar blockbusters at some stage of development or early deployment, as well as expectations for a return to normal in sales as COVID winds down further.
All of which means that GILD is likely to remain a cash cow for the foreseeable future and that it is possible that it is a bargain at or near current price levels. So, the bottom line is that as the market focuses on COVID-19 and Remdesivir the company is in fact moving steadily into its more reliable revenue streams, which suggests that the current buying is coming from investors who can see beyond the COVID fog. Whether this buying binge will continue is likely highly dependent on whether the stock can take out the $70 area and gain more momentum.
I own shares in GILD as of this writing.
NYAD Recovers After Midweek Rout
The New York Stock Exchange Advance Decline line (NYAD) made a new high on 5/7/21, which was followed by a rapid swoon and yet another recovery over the next five days. All of which left the market confused but still in an uptrend.
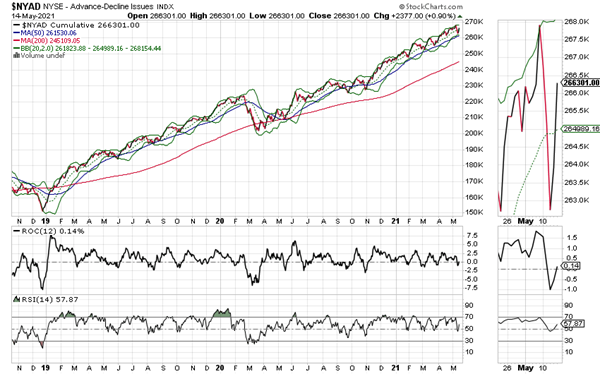
Again, as I note every week, the take-home message is that as long as NYAD continues to make new highs, remains above its 50- and 200-day moving averages and its corresponding RSI reading remains above 50, the trend remains up. This combined set of observations has been extremely reliable since 2016 and shows no signs of becoming unreliable as of this writing.
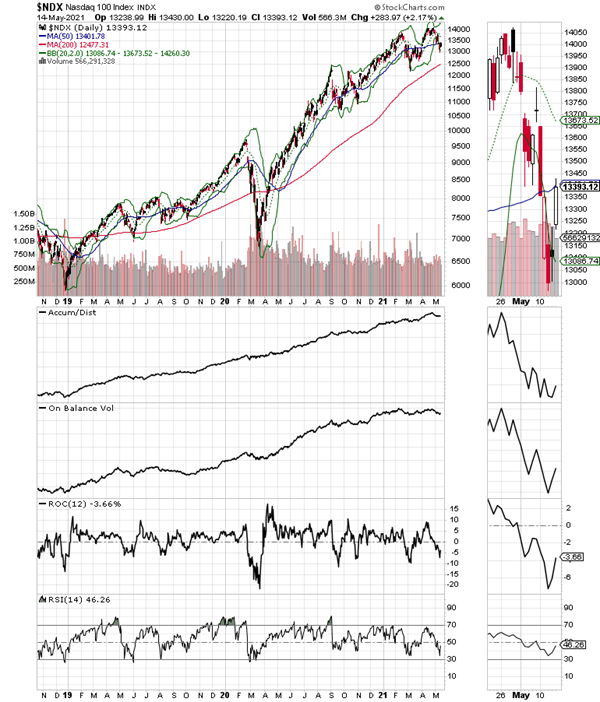
The Nasdaq 100 index (NDX) ended the week at its 50-day moving average but delivered a bona-fide oversold reading of near 30 on RSI during the recent selloff, which suggests that the index is likely to hold above its recent lows although a retest of the 13,000 area is not out of the question. If there is a retest and it holds it would likely signal a double bottom in the index although double bottoms are somewhat rare these days with the algos who like V bottoms running the market.
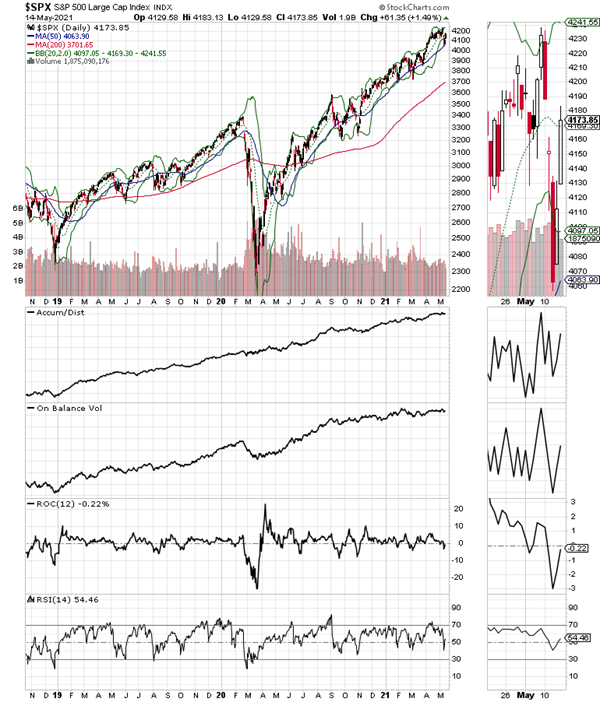
The S&P 500 (SPX) showed a bit of resilience during the recent selloff as it held at its 50-day moving average and the Accumulation Distribution (ADI) and On-Balance Volume (OBV) indicators did not break down. The index remains above its 20-, 50-, and 200-day moving averages.
To learn more about Joe Duarte, please visit JoeDuarteintheMoneyOptions.com.


