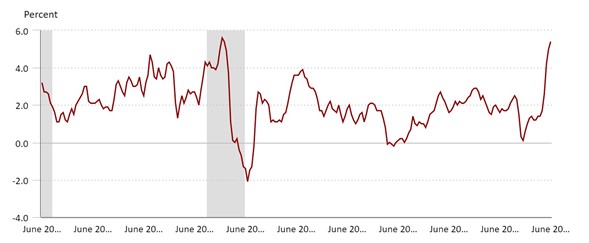
The government reported yesterday that consumer prices jumped 0.9% in June, up 5.4% over the past year, explains Marvin Appel of Signalert Asset Management.
This is the largest year-over-year increased since 2008. (See chart below from the Bureau of Labor Statistics) Core inflation (which excludes food and energy) for the past year has been 4.5%, its highest since 1991.
The financial markets reacted as if this data will pressure the Federal Reserve to raise rates. Not only did the yield on 10-year Treasury notes rise 5 bp to 1.41% on the day of the inflation report, but the yield on two-year Treasury notes climbed almost as much (3.6 bp). Changes in the two-year rate are most correlated to changes in the Fed Funds rate and have frequently provided advance warning of when the Fed is about to change course.

Here are some other observations that make it look like the markets are again paying attention to inflation:
- The US dollar jumped. This suggests that the Federal Reserve became more likely to raise rates. (Relative strength in currencies often tracks relative changes in real interest rates.)
- The Treasury Inflation Protected Securities ETF (TIP) was flat while the 7-10 Year Treasury ETF (IEF) lost 0.3%. Outperformance by TIPS over nominal Treasuries means that the Treasury market is raising its inflation projection.
Last month when the government released the May inflation report, the jump in inflation turned out to be just a blip in the markets; stocks and bonds sold off briefly before resuming their rallies. Will the same thing happen again this month?
The muted responses by large-cap equities on July 13 suggests market expectations that the Federal Reserve will be able to keep inflation in check with only modest adjustments to current policy. However, there are only so many inflation bullets that the market can dodge.
The best scenario would be one where good earnings news offsets the bearish implications of the Fed changing course. In that case, the S&P 500 Index would avoid a significant correction. However, under the surface we would continue to see a rotation from cyclical stocks to large-cap growth stocks, which is what occurred on the day of the inflation news. The shift from value to growth has been going for a more than a month, so perhaps the markets have anticipated news like yesterday's.
In my opinion, the base case is that the S&P 500 does have a 5%-10% correction over the summer. I view the repeated news reports confirming the return of inflation as analogous to the unfolding of the 2019 tariff conflict with China. Back then, the stock market ignored the first few salvos but eventually in May and late July finally pulled back, resulting in a five-month pause between market rallies. This year, I project that unrelenting inflation news will finally cause stocks to capitulate to some extent. But if inflation remains contained, as the Federal Reserve projects and the Treasury markets still imply (by the difference in yields of 10-year notes and 10-year TIPS), we should be able to avoid a major decline.
Indicators to Watch as Inflation Bellwethers
Here are a few things to watch in order to monitor the threat of inflation:
- Two-year Treasury note yield. (Any sustained rise over 0.25% suggests the possibility that the Fed will have to tighten.)
- IVE/IVW ratio (value to growth). This ratio made major lows on Nov. 6 and Sept. 2 last year, representing peak outperformance by growth. Extension of those lows would be bearish, suggesting that earnings headwinds are on the way.
- BKLN/HYG ratio (floating-rate to junk bond ratio). Floating-rate bonds should fare better when the Fed raises short-term rates, since the level of interest income from floating rates moves in parallel with the Fed Funds Rate.
To learn more about Marvin Appel, please visit Signalert Asset Management.


