

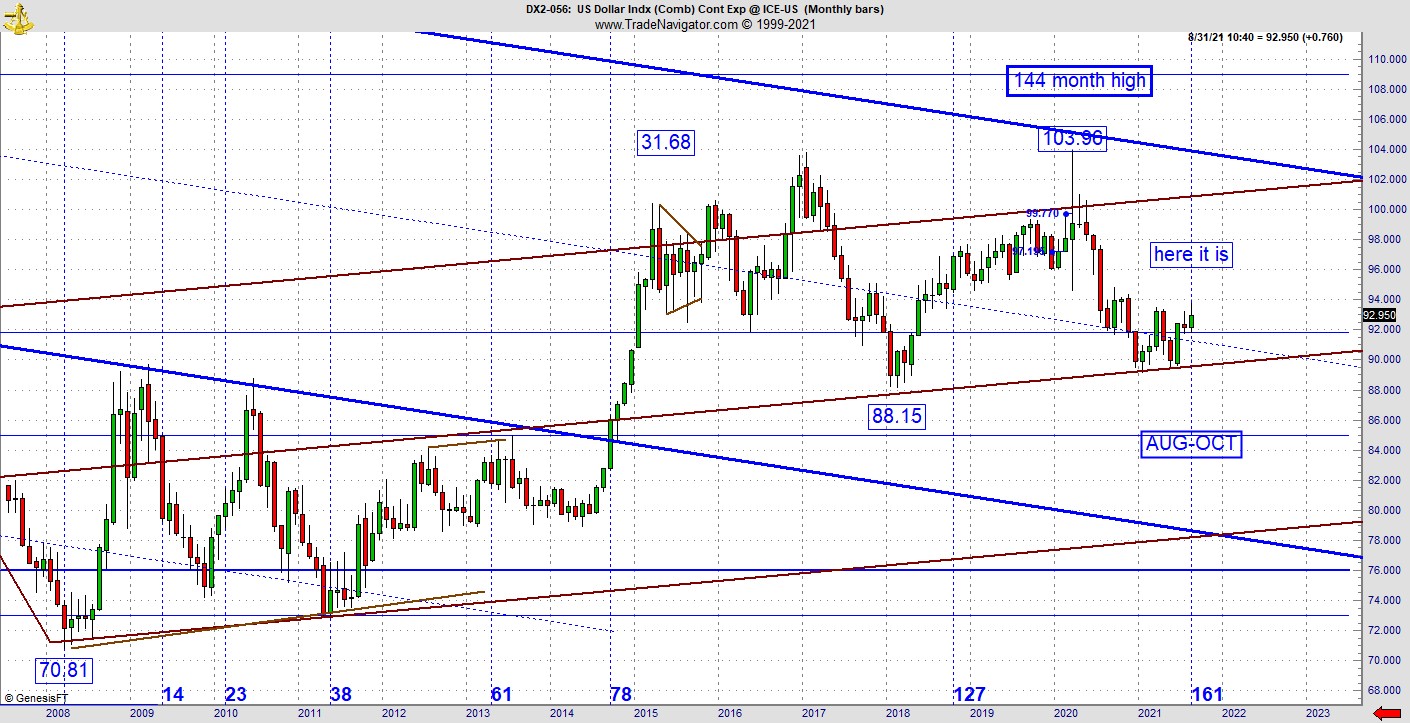
I’ve been warning months in advance about the big golden spiral cycle developing on the dollar monthly chart, explains Jeff Greenblatt of Lucas Wave International.
The US dollar is now officially on the clock. Personally, I have very mixed emotions about this. Allow me to explain. As you know we’ve been waiting on the pattern to get to the outer descending bear channel line. Last Friday, it stalled at the 163rd day of this rally leg since the bottom on January 6. On Monday, it put in a bearish engulfing candle formation on the daily time frame. Think about it, the US dollar changed direction on the 163rd day of a rally at the same time it hit the 161-month window off the 2008 bottom. I suppose the random walk theory crowd is going to lose this one.
Does this mean the greenback is done? Not yet but just following the pattern, the higher probability suggests this could very well be the one. It's good enough for the most aggressive to put up experimental short positions. That doesn’t mean to sell the farm, rather to dip one’s toes in the water because this could easily be one of those patterns that sneaks up on us and by the time it becomes obvious, its too late.
Here’s where I’m torn. By itself, a 161 window does not have to activate. Many don’t. That being said, the first leg peaked at 62 days up. When I trade on my intraday charts, this type of replication (62 on one leg, 161 overall or in this case 163) works about 75% of the time. This is not scientific because it’s impossible to backtest nonlinear tendencies. What I am saying is thru personal observation of hundreds if not thousands of similar patterns on smaller time frames, this is the sort of thing I’d engage most of the time. The usual result for me is a profitable trade. The outcome of this pattern bearing fruit would be the destruction of the US dollar.
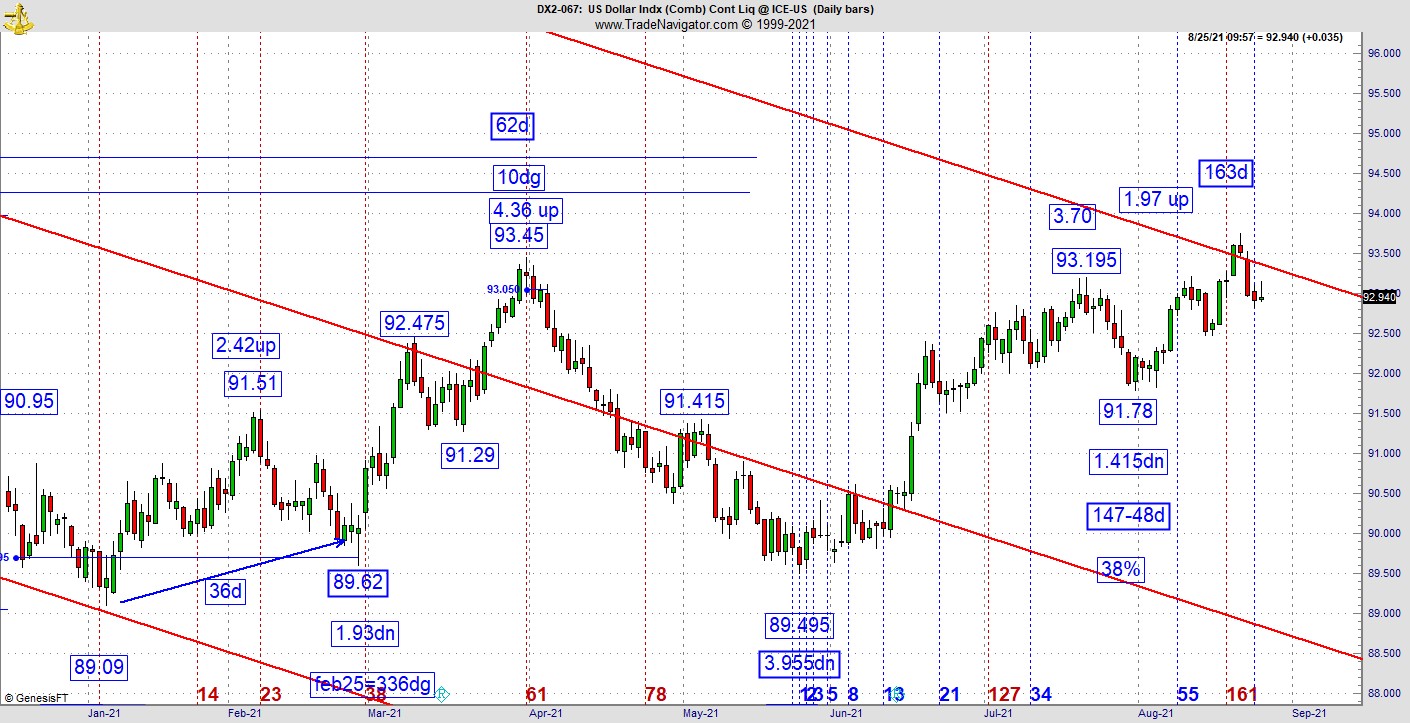
Do you see my dilemma? The truth of the matter is if the greenback is going to go, it will do it whether I’ve identified the pattern driving the bus or not. What I’m trying to tell you is if there is a holy grail to financial markets it would be this type of replication and I do like seeing it work out because I trade these kinds of patterns all the time. Consider the convergence of all the moving parts. We have 62 days up, 163 days up, 161 months and a pattern hitting the channel line all at the same time. Its not the sort of thing one sees every day.
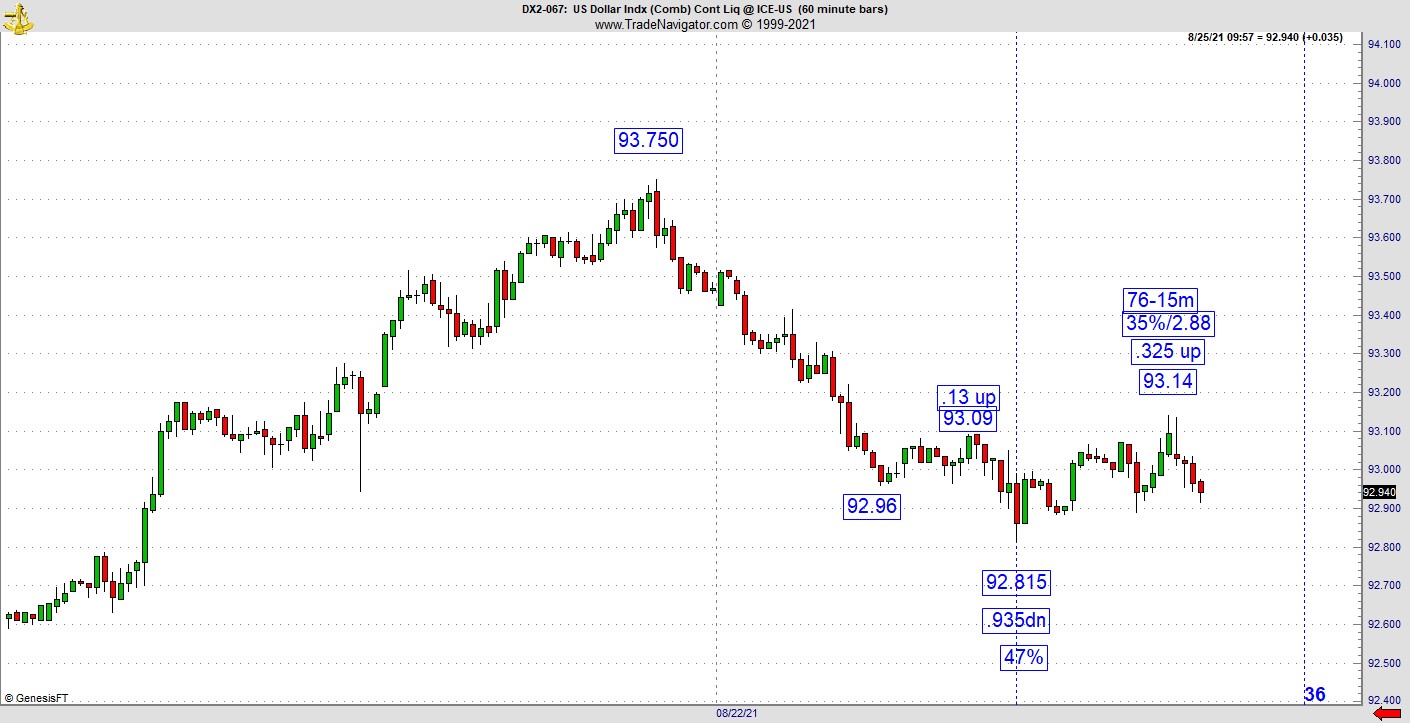
Are there any mitigating factors? Thankfully there is one and only one card the bulls have left. Notice how I warned you when it dropped in July it was coming to the 147th day of the rally and since the original range down on the continuation chart was 14.695 down, I alerted you to the 147th day and that’s exactly where it turned back up. Right now, it is trying to find a low at a 47% retracement to that 147-day reaction. So, we have twin vibrations at work right now. Obviously, the golden spiral is stronger because it’s linked to the monthly time frame, but the 147/47 vibration can’t be ignored either. What is the bottom line? Odds will greatly increase for the confirmation of the top if and when the pattern takes out Tuesday morning’s low.
Here’s another consideration not to be ignored. The situation in Afghanistan has been compared to the fall of Saigon and if you are of a certain age, you’ll never forget it. It is clear confidence around the world in the US has been greatly diminished. The US dollar is truly only as good as the people’s confidence in the currency since it's not backed by gold. It should not be lost on anyone that we left Afghanistan the same week the dollar golden spiral window activated.
The size and scope of this cycle point could end up matching the historic significance of the events still materializing in Afghanistan. However we slice it, this event is not considered to be a black swan as the stock market continues to stay at highs. If the dollar does confirm, my concern is people won’t figure this out until the move becomes obvious, which would already be too late.
It's really too early to project where the greenback would go if it confirmed but my sense of it could be a retest of the 2008 bottom. That would be roughly another 22% drop from here. Right now, it’s already over 17% off its high from 2020.
For more information about Jeff Greenblatt, visit Lucaswaveinternational.com.


