Sentiment is changing nearly daily, producing wide swings in the S&P 500 (SPX), says Larry McMillan of Option Strategist.
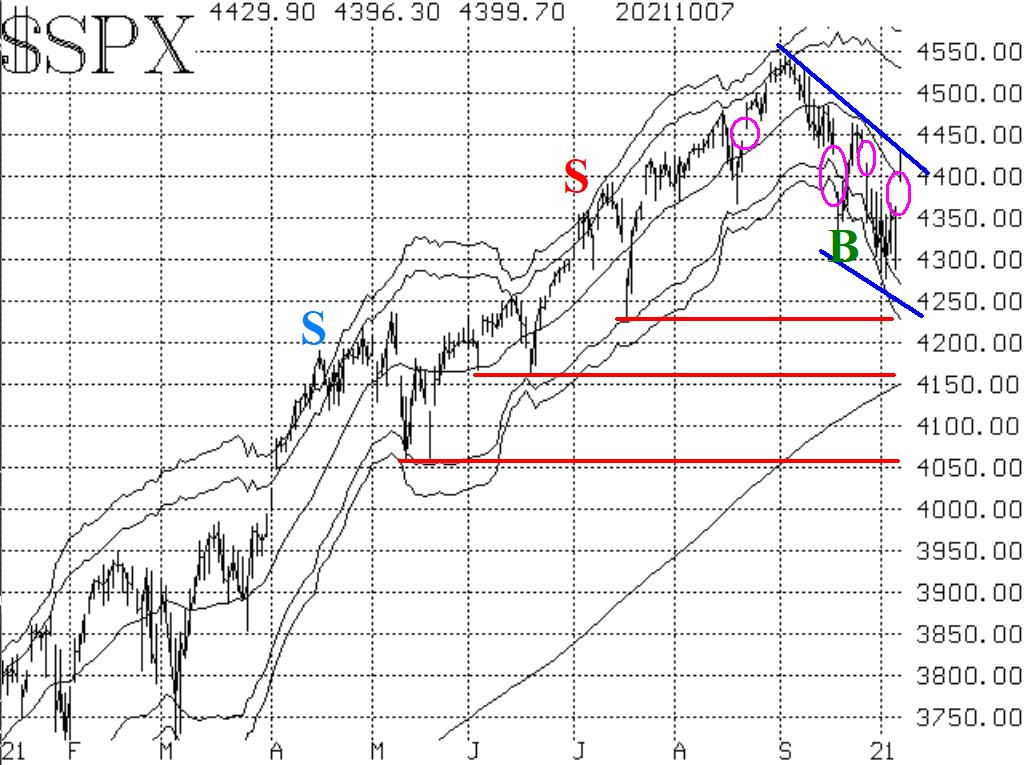
The Index is still in a downtrend, with lower highs and lower lows on its chart (blue lines in Figure 1). The lower end of the range is just below 4300, as there were several rather strong reversals from that area in the past week. On the upside, there is resistance up to 4465. A broader view shows three support areas (horizontal red lines in Figure 1) at 4233, 4160, and 4060 and, of course, resistance at the all-time highs (4545).

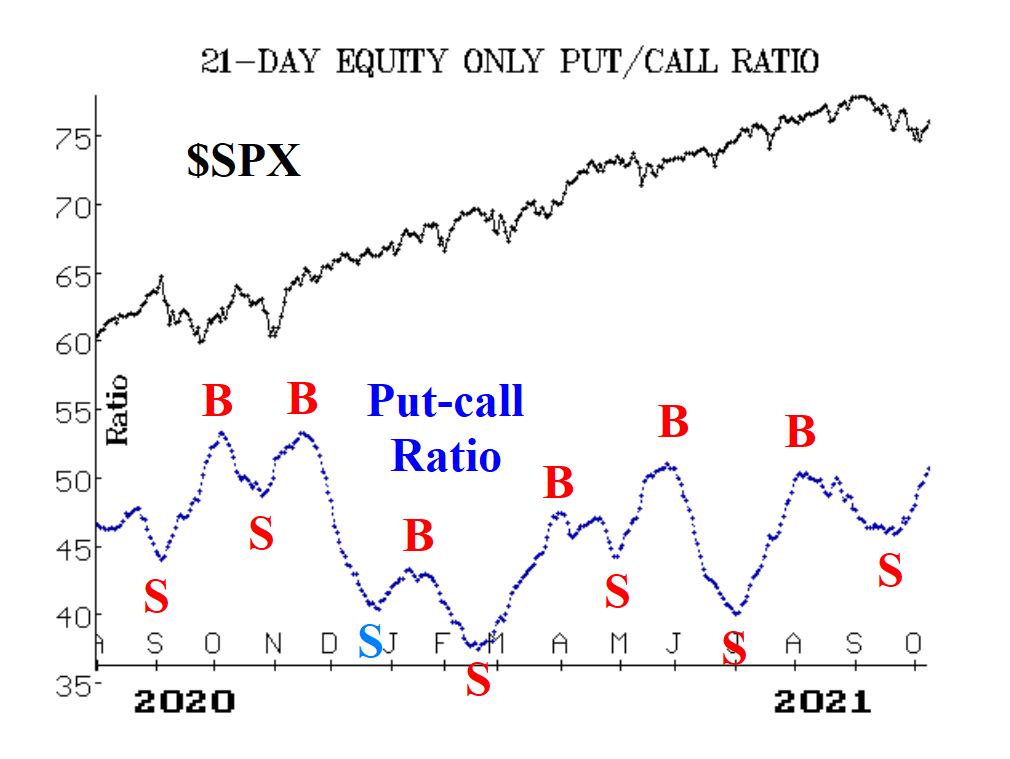
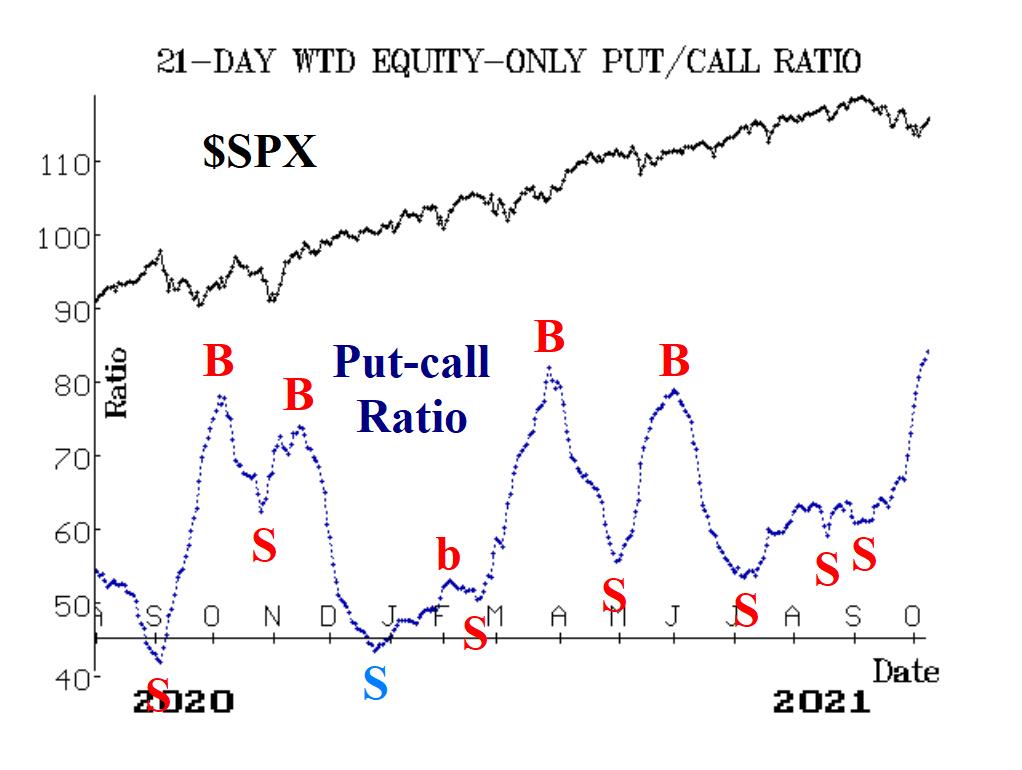
Equity-only put-call ratios remain on sell signals. As you can see from Figures 2 and 3, both ratios are still racing higher. That is bearish for stocks, in general. The weighted ratio has reached its highest level in over a year, which might make it "oversold," but these indicators won't turn bullish until they roll over and begin to trend downward.


Market breadth has continued to be strong enough to keep the breadth oscillators on buy signals, even throughout some pretty nasty down days in the last couple of weeks.
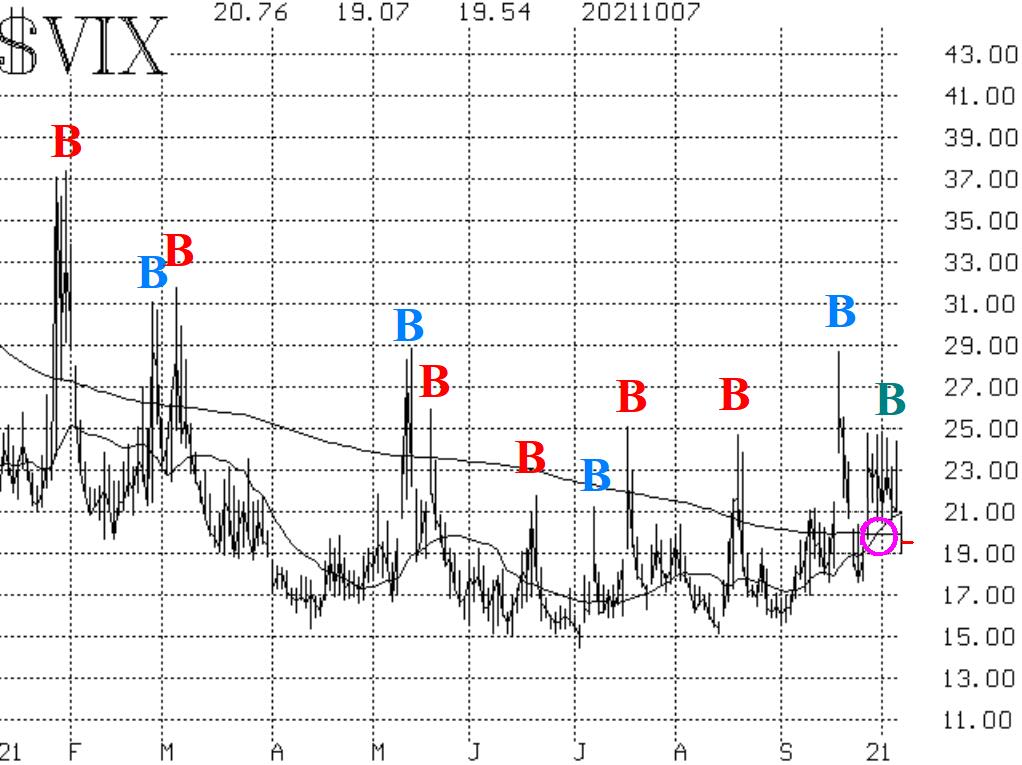
Implied volatility indicators are somewhat bullish. First, the CBOE SPX Volatility Index (VIX) "spike peak" buy signal of October 1st remains in place. Next, the trend of VIX is in more jeopardy, however. On September 30th, the 20-day moving average of VIX crossed above the 200-day MA (circle on the chart in Figure 4). It is still above.

Seasonally we are in a negative period for stocks. Usually, selling begins in September and terminates in October (sometimes violently).
In summary, the indicators are certainly mixed. Prior to the huge upward reversal that took place on October 6th and 7th, the outlook was more bearish in that SPX was trending lower and VIX was trending higher. Those trends are certainly coming into question right now, but for the time being, we are maintaining a "core" bearish position because of those trends. Of course, we are trading other signals around that "core" position.


