

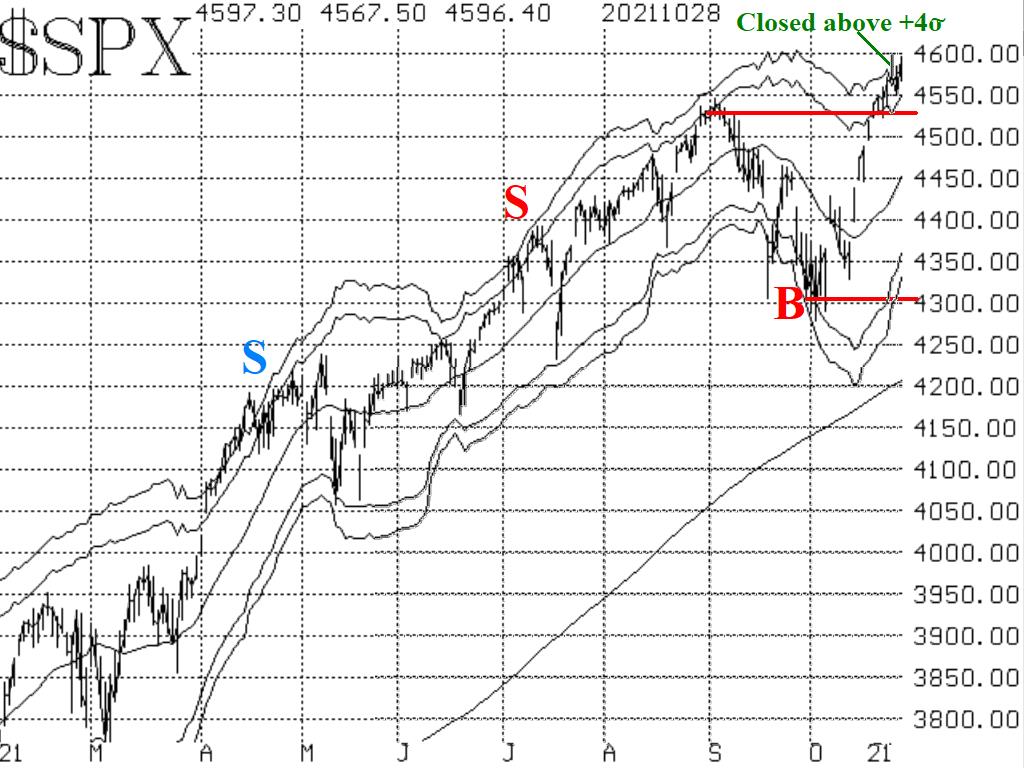
Major indices broke out to new all-time highs to close out the week, says Larry McMillan of Option Strategist.
This included S&P 500 (SPX), the Dow (DJX), and NASDAQ (NDX; QQQ)—just barely for QQQ. The Russell 2000 (RUT; IWM) is noticeably lagging. In any case, we use SPX as "the market," and it is strong. This breakout has re-established a "bullish" rating for the SPX chart.
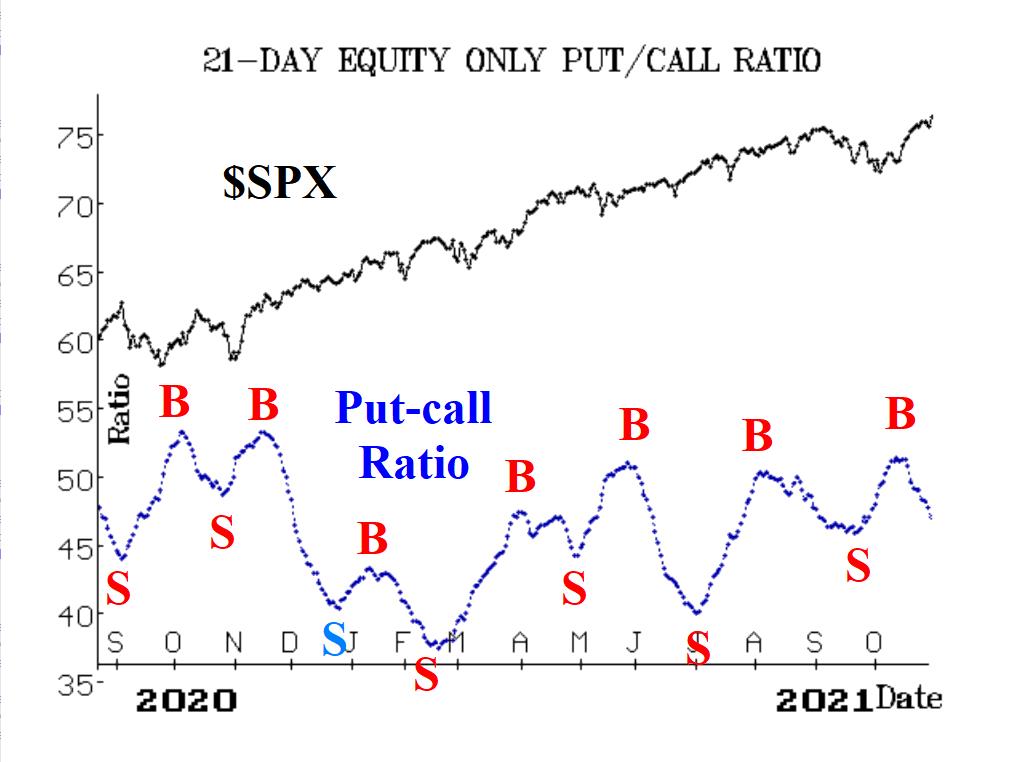
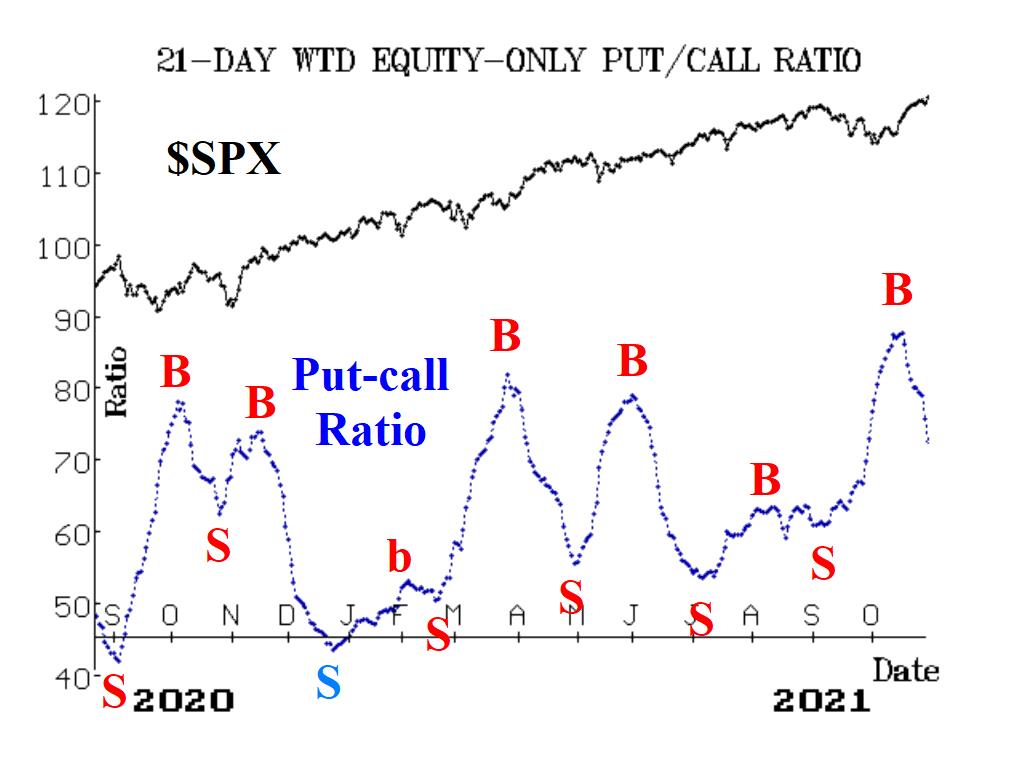
Meanwhile, the equity-only put-call ratios remain on the well-timed buy signals that took place near the beginning of October. The ratios will remain bullish for as long as they continue to decline. Market breadth has mostly been supportive of the bullish advance by SPX.
Our breadth oscillators feigned a sell signal, but remain on buy signals at the current time. The entire set of indicators based on implied volatility derivatives and the CBOE SPX Volatility Index (VIX) continues to be bullish for stocks at this time. The VIX "spike peak" buy signal of October 1st remains in place.
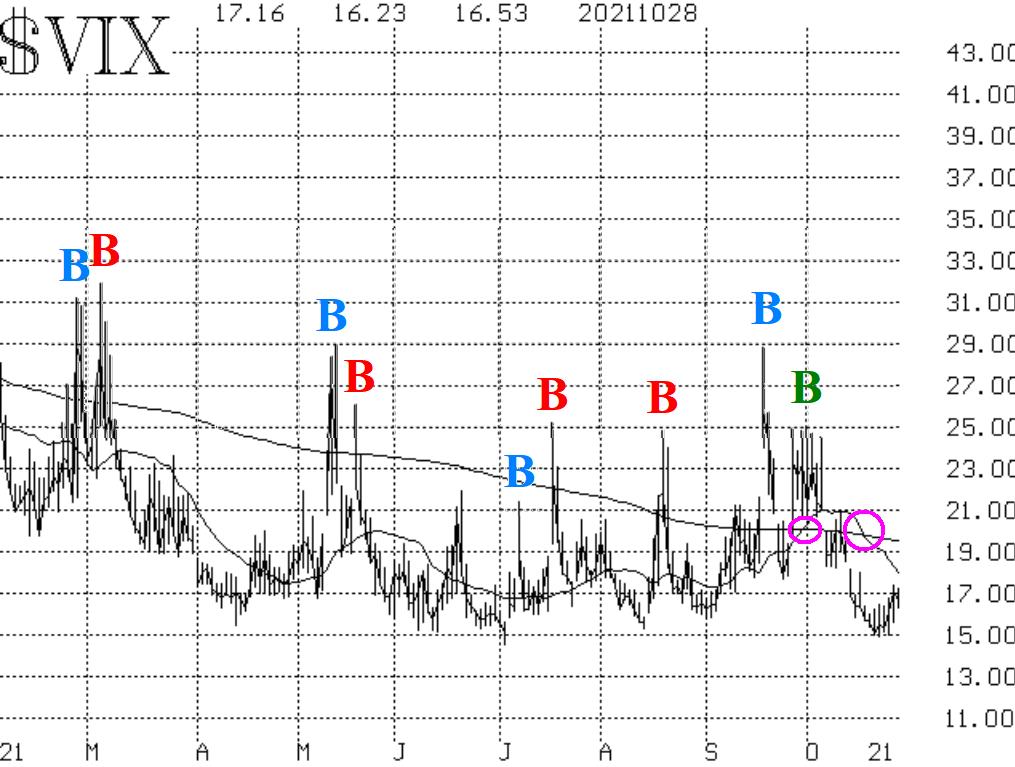
The trend of VIX is downward, and the construct of volatility derivatives is bullish for stocks. In summary, the SPX chart is positive, so a "core" bullish position should be in place. It can be supplemented with additional positions based on confirmed signals, and most of those are bullish at this time as well.


