

A volatile week, seven of the eleven sectors fell, states Bonnie Gortler of bonniegortler.com.
There were four sectors weaker than the SPDR S&P 500 ETF Trust (SPY), down -1.97%. Defensive sectors led the way. Health Care (XLV) and Real Estate (XLRE) were the strongest sectors, while Consumer Discretionary (XLY) and Energy (XLE) were the weakest.
S&P SPDR Sector ETFs Performance Summary
12/10/21 - 12/17/21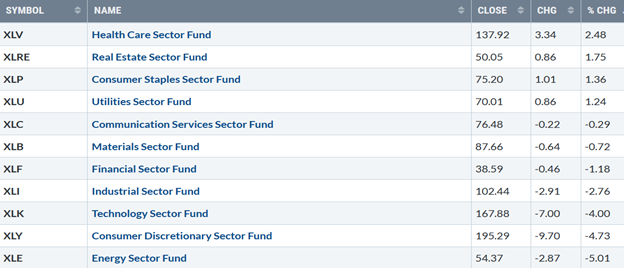
Source: Stockcharts.com
Figure 2: Bonnie's Mix of ETFs To Monitor
Summary 12/10/21– 12/17/21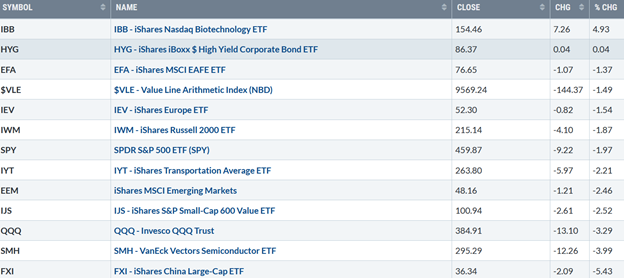
Source: Stockcharts.com
Investors were not in the holiday spirit, in risk-off mode. Technology and Semiconductor stocks were under selling pressure. Biotechnology, which was out of favor, reversed to the upside. International markets continued to be weaker than the US.
All major averages finished the week lower. The Dow fell -1.68%, the S&P 500 lost -1.94%, and the Nasdaq was fell -2.95%.
The Russell 2000 Index (RUT) lost -1.71%, and the Value Line Arithmetic Index (a mix of approximately 1700 stocks) fell -1.49%. 10 - Year US Treasury yields fell, closing at 1.402, above support at 1.25, and below resistance between 1.65% and 1.80%.
Weekly market breadth had no follow-through to last week’s improvement on both the NYSE and Nasdaq. The New York Stock Exchange Index (NYSE) had 1117 advances and 2435 declines. Nasdaq had 1602 advances and 3465 declines. There were 193 new highs and 425 new lows on the NYSE, and 208 new highs and 1070 new lows on the Nasdaq. Market breadth needs to improve for a rally to be sustainable in the near term.
Figure 3: Daily New York Stock Exchange (NYSE) New Lows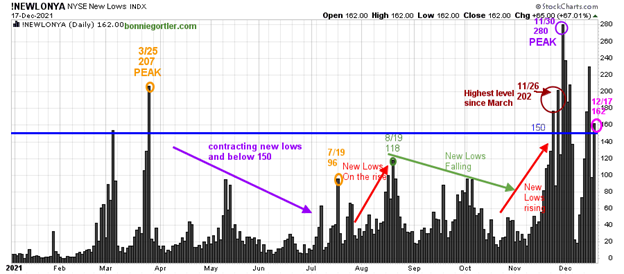
Source: Stockcharts.com
Watching new lows on the New York Stock Exchange is a simple technical tool that helps awareness about the immediate trend's direction.
Learn more in my book, Journey to Wealth. Here is an excerpt, "If the new lows are above 50, it is an alert or warning of possible market weakness or a change in market tone. Be aware, it’s a good idea to make sure you are happy and comfortable with your portfolio. It is best not to have more volatile investments than you can handle where you feel uncomfortable. If the selling continues, you could have serious losses if the market falls further. When new lows are above 150, the market is negative, higher risk, selling is taking place. Sometimes it could be severe, and sometimes on a very nasty day, you can have 'panic selling,' and big wild swings (high volatility) to the downside may occur."
New lows rose, closing at 162 (pink circle) on 12/17, not in a low-risk zone yet well under the 11/30 peak of 280. It will be a positive sign if new lows fall to between 25 and 50. On the other hand, news lows remaining above 150 would be undesirable, signaling more weakness.
Figure 4: Daily Nasdaq Advance-Decline Line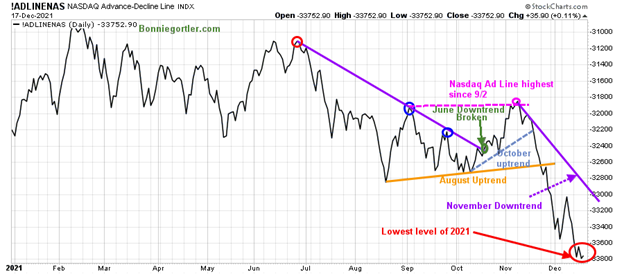
Source: Stockcharts.com
The daily Nasdaq AD-Line broke the June downtrend (purple line) and climbed. The first week of November, the AD-Line rose sharply to its highest level since 9/2 (pink circle), stalling at resistance and turned down, breaking the October uptrend (blue dotted line), an advanced warning a decline was forthcoming. Then, the August uptrend was broken (orange line) in late November, followed by a series of new lows.
Last week was disappointing, as market breadth had no follow-through to the previous week's strength. The Nasdaq AD-Line remains weak, making a new low (red circle) unable to establish a favorable bottom formation. More time is needed for a safer buying pattern to develop.
Figure 5: Daily Nasdaq New Highs 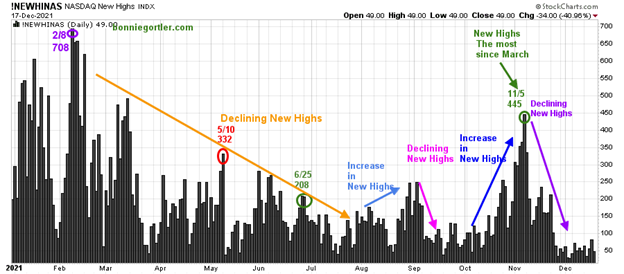
Notice the decline of new highs on the Nasdaq since November. It’s much more of a challenge to make money when market breadth is weak and fewer stocks are making new highs.
New highs are extremely low, only 49 on December 17; until there is better action in market breadth and more stocks make new highs, the risk is high.
Figure 6: Daily iShares Russell 2000 (IWM) Price (Top) and 12-26-9 MACD (Middle and Money Flow (Bottom)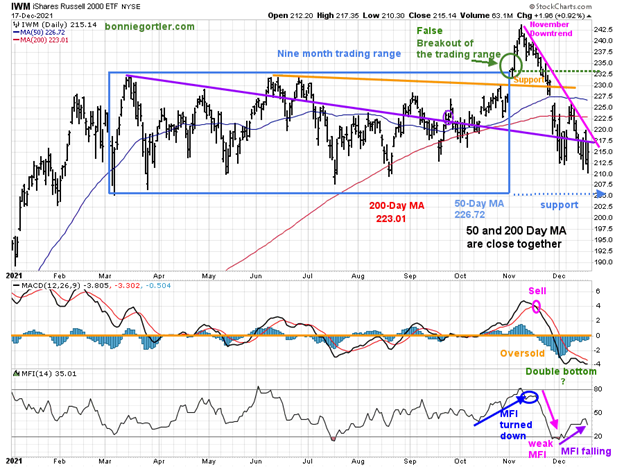
Source: Stockcharts.com
The top portion of the chart is the daily iShares Russell 2000 Index ETF, the benchmark for small-cap stocks, with a 50-Day Moving Average (MA) (blue line) and 200-Day Moving Average (MA), that traders watch and use to define trends. A false breakout occurred in IWM after being in a nine-month trading range.
IWM held 210.00 support last week with a low of 210.30, but IWM remains in a November downtrend, down -1.87%, closing at 215.14. IWM continues to close below its 50-and 200-Day Moving Average. Support is 210.00, followed by and 205.00. Resistance is at 220, followed by 227.00.
MACD (middle chart) remains on a sell, oversold, and below zero. An immediate turn-up would create a double bottom which would be a positive sign for a potential short-term rally. Money Flow (lower chart) had turned up and stopped falling, a sign that investors were stepping into small caps in the short term, but money flow is falling again. Any rally is suspect until the downtrend in IWM, at minimum, is broken. However, risk remains high, with IWM on the intermediate-term not yet showing favorable relative strength.
Figure 7: Daily Invesco QQQ Trust (QQQ) Price (Top), Money Flow Middle), and 12-26-9 MACD (Bottom)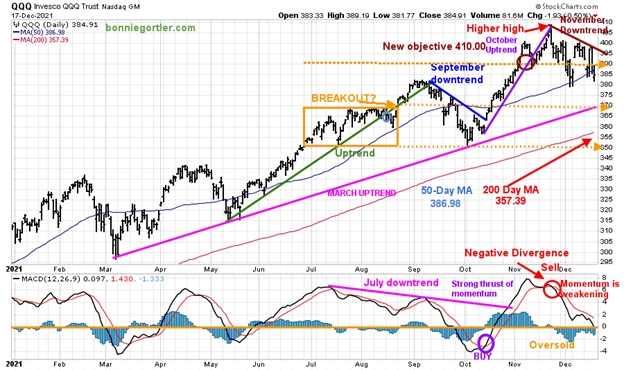
Source: Stockcharts.com
The chart shows the daily Invesco QQQ, an exchange-traded fund based on the Nasdaq 100 Index, with its 50-Day Moving Average and 200-Day Moving Average. In June, QQQ was in a trading range (orange rectangle) and then broke out above 370.00 in August, which failed. A decline followed to 350.00 support in late September. After breaking the short-term downtrend 10/7 (blue line), QQQ continued to climb in November, close to its upside target of 410.00 on 11/22 with a high of 408.71, before reversing lower.
QQQ was under selling pressing last week after falling below 390.00 support, closing at 384.91, down -3.29%; led by Apple (AAPL), down -4.63% and Microsoft (MSFT), down -5.47%. Both stocks combine for over 20% of QQQ and will continue to impact QQQ performance. The March uptrend (top chart) remains intact (pink line). QQQ broke the November downtrend and is 5.82% from its high of 408.71 on 11/22. Many growth stocks continue under selling pressure, have fallen 20-50%, and are nowhere near their highs.
The lower chart is MACD (12, 26, 9), a measure of momentum. MACD gave a timely buy and is on a sell, slightly above zero. Support is 380.00 followed by 370.00, a key area now that needs to hold. Resistance is at 390.00, followed by 400.00. A close below 370.00 would shift the trend to down, make it harder to make money, and likely fuel more selling in Nasdaq. For now, give the bulls the benefit of the doubt if QQQ holds above 380.00 and turns up early next week. On the other hand, a close below 380.00 would imply more weakness to 370.00 at a minimum.
Figure 8: Van Eck Semiconductors (SMH) Daily Price (Top), Money Flow (Middle), and 12-26-9 MACD (Bottom)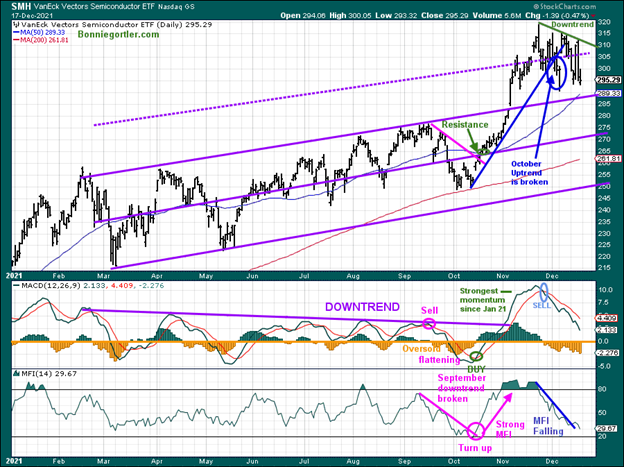
Source: Stockcharts.com
Semiconductors had a great run in October, leading the technology sector higher. The October uptrend was broken (blue line), and the easy money is over. Semiconductors fell -3.99%, closing at 295.29, slightly below support at 296.00 last week. The next support is 289.00.
MACD (middle chart) remains on a sell after very strong momentum. MACD remains on a sell and is still falling. More time is needed for MACD to reset and go below zero. Money flow (lower chart) blipped up, breaking the downtrend (blue line), but is falling again.
I recommend caution until Money Flow turns up for a few days in a row and MACD is no longer falling, showing a sign of downside momentum has stopped.
Intermediate-Term in Jeopardy
Figure 9: SPDR S&P MidCap 400 Weekly Price (Top), and 12-26-9 MACD (Bottom)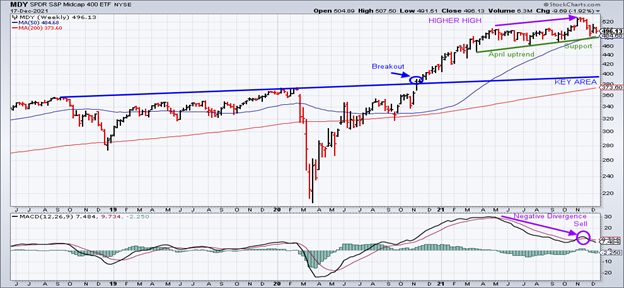
Source: Stockcharts.com
The top chart shows the Weekly SPDR S&P MidCap 400 (MDY). Notice how MDY in October (purple line) made a higher high in price and is unconfirmed by MACD (lower chart), forming a negative divergence and is on a sell.
Figure 10: SPDR S&P S&P 500 Weekly Price (Top), and 12-26-9 MACD (Bottom)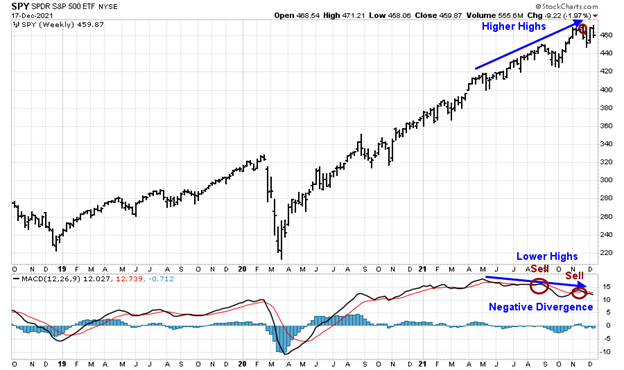
Source: Stockcharts.com
The chart shows the weekly SPDR S&P 500 (SPY), Notice how SPY made higher highs peaking in November. MACD (lower chart) has made lower highs weakening momentum and forming a negative divergence on a sell.
Figure 11: Weekly Invesco QQQ Trust (QQQ) Price (Top), and 12-26-9 MACD (Bottom)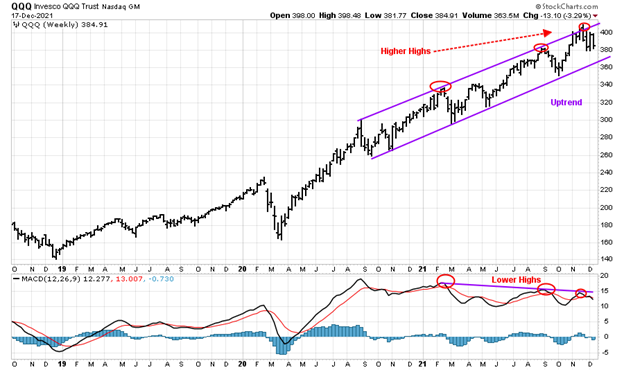
Source: Stockcharts.com
The top chart shows the weekly Invesco QQQ Trust has been in a weekly uptrend since September 2020. Notice how QQQ made higher highs peaking in November (red circles).
MACD (lower chart) is on a sell, MACD has made lower highs, weakening momentum, forming a negative divergence.
What to Watch for Short-Term Direction This Week?
Figure 12: New York Stock Exchange AD-Line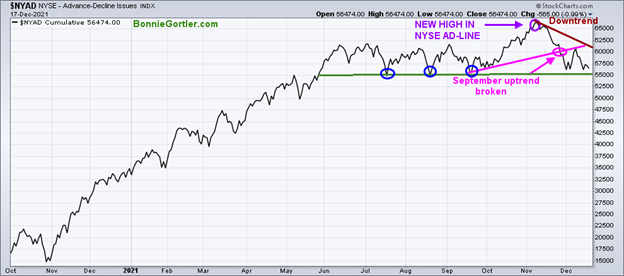
Source: Stockcharts.com
In the top portion of the chart (Figure:11), The NYSE A/D line made a new high on 11/8/21, but since then, it has fallen, and it’s negative. As a result, the September uptrend is no longer in effect. As a result, it’s harder to make money with market breadth negative. The November downtrend remains in effect (brown line). The lows made in July, August, and September are essential to hold (blue circles), or a more severe correction is likely.
Figure 13:Daily Financial XLF Price (Top) and Relative Strength Ratio (XLF)/S&P 500 (SPY) Bottom
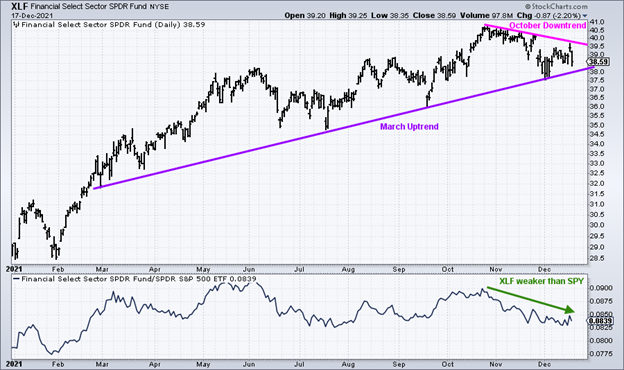
Source: Stockcharts.com
Financials (XLF) (top chart) have remained in an uptrend since March 2021, but have been in a downtrend since October. The lower chart: a rising line means the XLF is stronger, and if falling, the SPY is stronger. The last few months have been whippy with numerous turn-ups and turn downs. Since October, the XLF/SPY ratio has been trending down, showing XLF weaker than the S&P 500 (SPY). There is no rush to buy until there are signs that XLF is consistently outperforming the S&P 500.
Figure 14: ARKK Innovation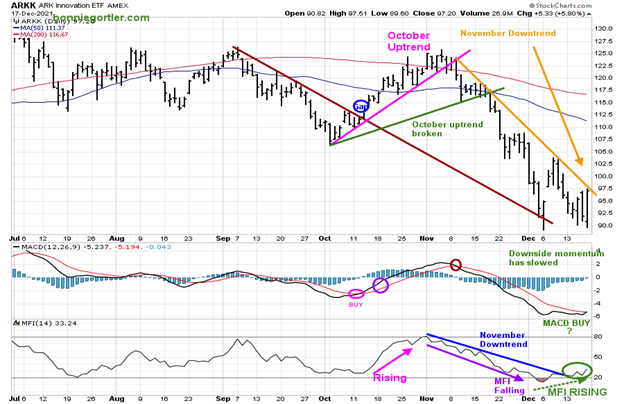
Source: Stockcharts.com
ARK Innovation ETF (ARKK), an actively managed ETF by Cathie Wood that seeks long-term growth. ARKK broke its September short-term downtrend (brown line) in October and gapped up, followed by a failed rally. ARKK has sold off sharply since its peak at 125.86 on 11/04 to its low at 89.03, a decline of -29.30%. MACD remains on a sell, close to a buy, but its encouraging MACD has stopped falling, and its downside momentum has slowed. Money flow (lower chart) was trending down and is now rising, a positive sign, and it broke the November downtrend. Short-term resistance is 100.00, 103.00, followed by 108.00. Support is at 90.00/ A close below 90.00 would imply another leg down is possible.
On Friday 12/17, ARKK was up +5.8%, closing above Thursday high and near its high of the day much stronger than the major averages. Further strength would imply selling in the beaten-down growth stocks may be overdone and ready to start a leg higher in the near term.
Summing Up:
All three major averages fell last week. Market breadth was negative, reversing the improving breadth from the previous week. Technology stocks no longer advanced as investors sold and rotated into defensive sectors. A mixed message now. The short-term is oversold and in a position for a rally if the market stabilizes early in the week. The intermediate-term trend is in jeopardy as momentum oscillators weaken, showing clear negative divergences implying increased risk. With lousy market breadth, technology and semiconductors stocks no longer leading the market higher and the intermediate trend momentum weakening, caution is necessary. If Russell 2000 (IWM) closes below support at 210.00 and QQQ closes below 370.00, the risk of a severe correction of the major averages rises substantially.
Remember to manage your risk, and your wealth will grow.
I would love to hear from you. If you have any questions or comments or would like to talk about the market, email me at Bonnie@Bonniegortler.com.
Disclaimer: Although the information is made with a sincere effort for accuracy, it is not guaranteed that the information provided is a statement of fact. Nor can we guarantee the results of following any of the recommendations made herein. Readers are encouraged to meet with their own advisors to consider the suitability of investments for their own particular situations and for determination of their own risk levels. Past performance does not guarantee any future results.


