

I hope everyone had a great holiday. I had a lot of down time as I haven’t had any in recent memory. So, this is 2022 and its going to be a particularly important year on a lot of levels, explains Jeff Greenblatt of Lucas Wave International.
I have my own research and I follow some other reputable cycle experts who are anticipating a rough year. So, I’m going to say two things before we get started. Number one, and by far the most important thing I’ll ever tell you is trade them as you see them, not as you’d like it to be or what you think it should be.
Number two, this is the Fourth Turning. I’m not going to repeat this every week. I’m not a cheerleader for the market nor am I one of these doom-and-gloom types. I consider myself a keen observer of everything from social mood to the Fed all the way down to a one-minute vibration that turns the E-mini. What I’m trying to say is I ride a fine line between keeping my head in these charts while at the same time respecting the incredible power of the Fed and what they’ve been doing these past couple of years. Many don’t like what they see, and they are not wrong.
What does the Fourth Turning have to do with our work? Simply put, you will have to be ready for the unexpected more than you ever have in your entire trading career. The bottom line is I don’t like what I see as far as social mood is concerned and I could say the same thing about Powell and Janet Yellen. But we have to trade them as we see them. I’m going to take each market condition one sequence at a time. I don’t think this is going to be a year where you can place your buy orders and walk away from the screen.
Hopefully, my vibrational work will give us advance notice of any trouble. Right now, I have an interesting situation to show you on the KBW Nasdaq Bank Index (BKX). Recall we’ve been following this chart closely for weeks.
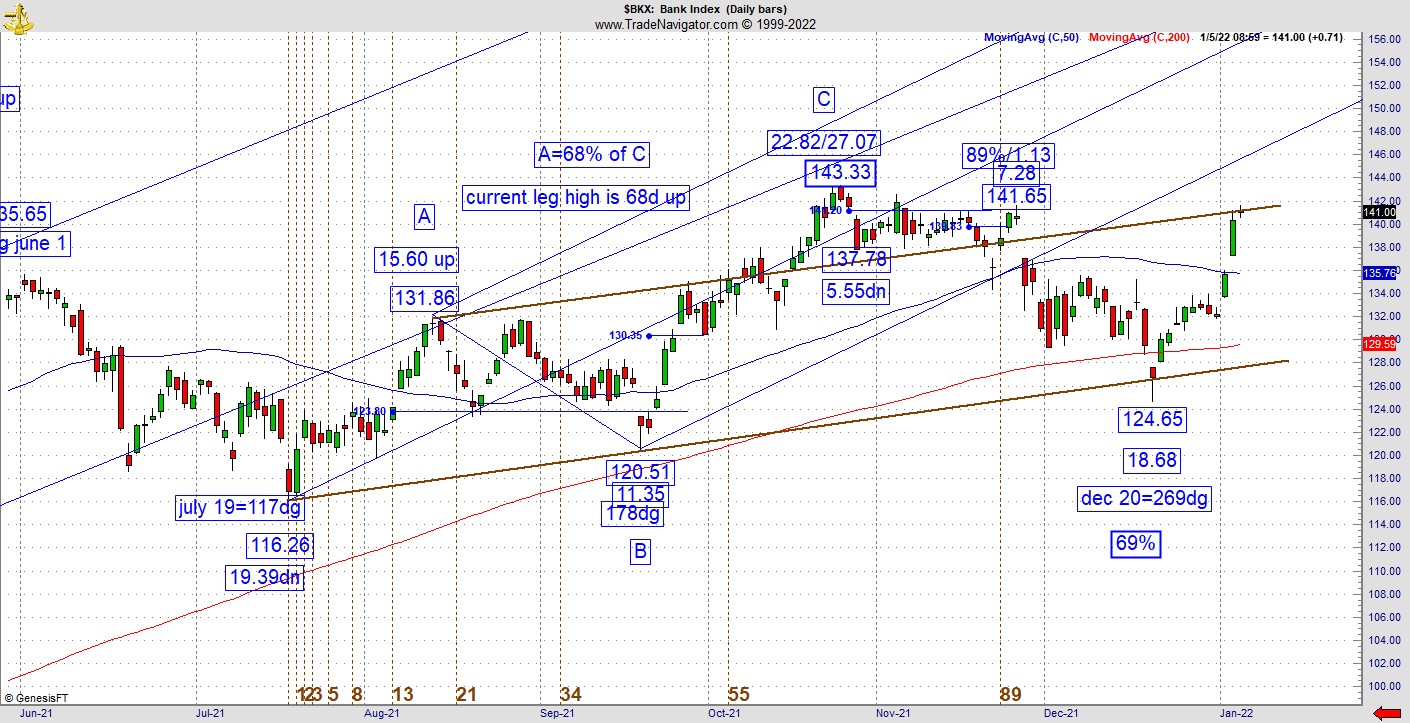
This low did manifest over the holiday while I was gone. This is more a study than anything else. So, what is the value in this exercise? As it relates to me and what I’ve shown others to do, study these tendencies because they repeat over and over. From the low in July, this chart rallied up to October 25, and I’ve shown you the relationship. We had an ABC up where A was 68% of C and the whole thing was 68 days. We’ve discussed this aspect of the chart many times. It finally broke the 200dma, but the institutions came in to defend right there. What held the pattern? A connect the dots trend line.
There’s a lot of support starting at that level as you can see all the congestion surrounding the lows in July and September. We came down to an important level. Here’s why I’m showing you this chart. With the ABC up, the door was always open to a 5th wave-style leg making a new high. The challenge is odds went down on that possibility once the 200 was breached. But look what happened at that trend line. Starting with the move up from July 19, the December 20 low was a 69% retracement of the move up and it was vibrational day 269 for the year on the Gann calendar.
I hope you study this carefully as nobody else is going to show you a chart like this. Here’s the challenge. I spent the better part of 2021 teaching people how replication of numbers on a price chart works. You might never see a better example than this. The problem is we can’t anticipate it. There are any number of possibilities that could’ve turned this chart but didn’t.
Gann warned never to front run the bars and we know Japanese candlesticks are a great tool in determining whether bulls or bears have the upper hand. So, we want to see a reaction first, then do the calculation. Many times, there is nothing to see but sometimes the reading will jump right off the page. Right now, the banks are right back where we started two months ago with a big test of the 200 under its belt. It stalled at that intermediate level trend line and next up is a retest of the top.
What is the takeaway from a chart like this? Obviously, for the overall market to have any chance this year, its going to need the banks to carry their fair share of the load. They are going to have to do it since the S&P 500 (SPX) and Dow (DJI) are making new highs, the Nasdaq 100 (NDX) and Dow Transports (DJT) are showing a mild bearish divergence. The Ten Year is also looking at recent support from November.
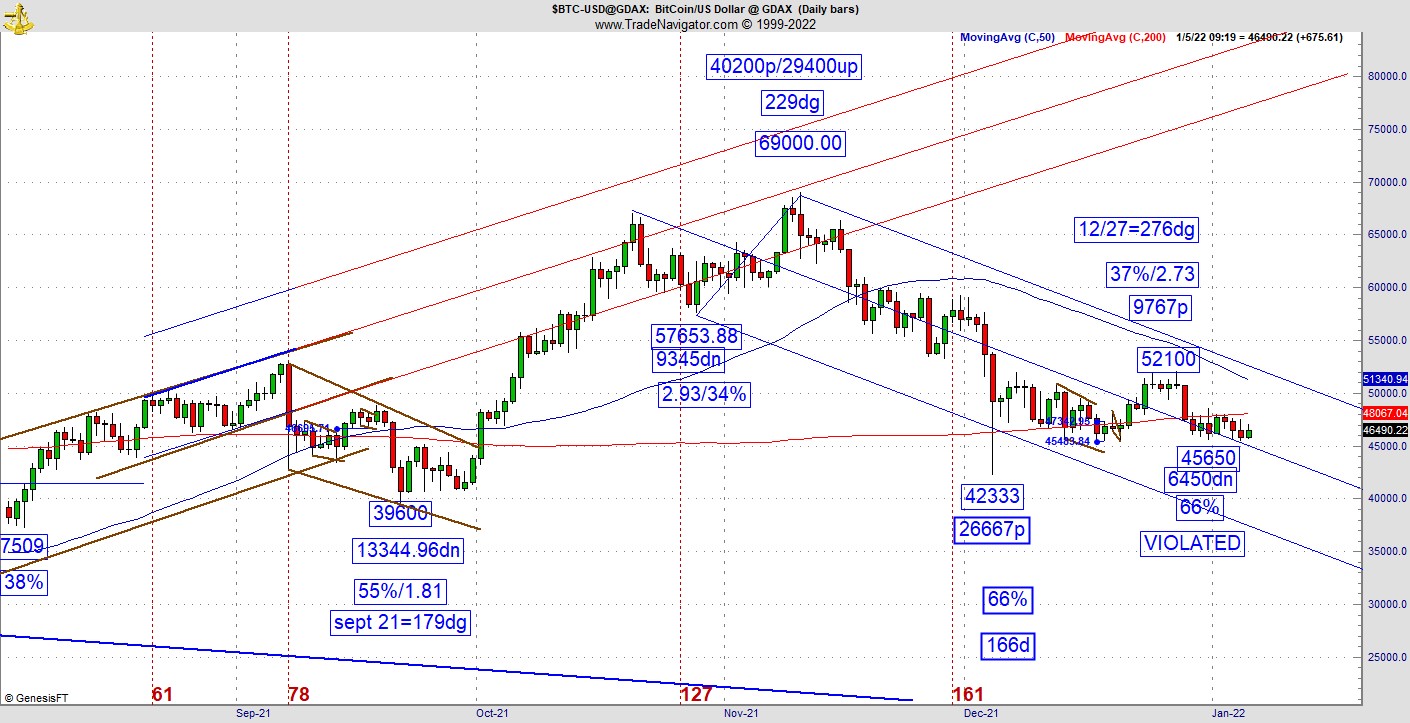
The other chart of the week is Bitcoin (BTC). This is an incredible vibration at the December low. It's down 26667 points, which is a 66% retracement at 166 days off the bottom. In a healthy market a vibration like this can propel the price action into outer space. This is not even close. Yes, it tried to break out but stalled. Now it's sitting near another 66% retracement in this recent congestion and has violated it. I don’t know what the problem is; all I can tell you is this chart isn’t behaving the way it should if it were a healthy environment. There are many fans of crypto hyping these instruments, telling us they are going to the moon. That might be true, but the pattern is warning us of potential trouble. If you can stick with and trade the pattern as you see it, you’ll be fine.
For more information about Jeff Greenblatt, visit Lucaswaveinternational.com.


