In his landmark book called The Dollar Crisis, Richard Duncan states that governments have the power to kick the can down the road much further than most people think possible. The question smart people should be asking is the following. How much further is the Fed capable of kicking the can down the road, explains Jeff Greenblatt of Lucas Wave International.
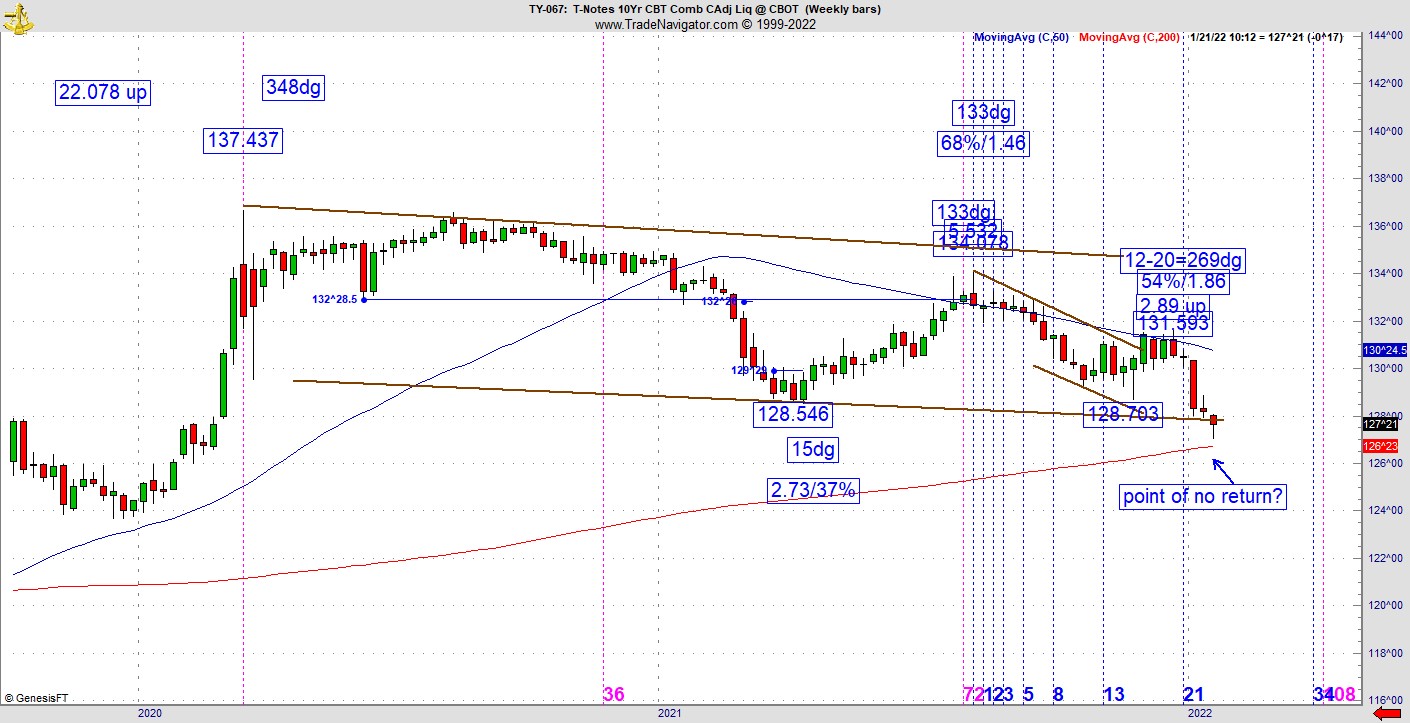
I’m going to show you today it’s later than we think and very possible we could be in the eighth inning of a game the economy is destined to lose. How could I say that? All other things being equal, the Fed plans on raising rates multiple times in the year going forward. The stock market will have a tough time pretending it's 2021 all over again in a higher rate environment. Let’s get started with a weekly Ten-Year chart.

I’m showing you the daily continuation chart on a weekly time frame. As you can see, the pattern broke through the 2021 low and is holding the 200-week moving average. If I were to show you the actual weekly continuation, the price action is already looking up at 50– and 200-week moving averages. In other words, this is an instrument the Fed does not control and is close falling down a rabbit hole where there is no return. If this charts breaches and closes below this 200, it could be tough putting the genie back in the bottle.

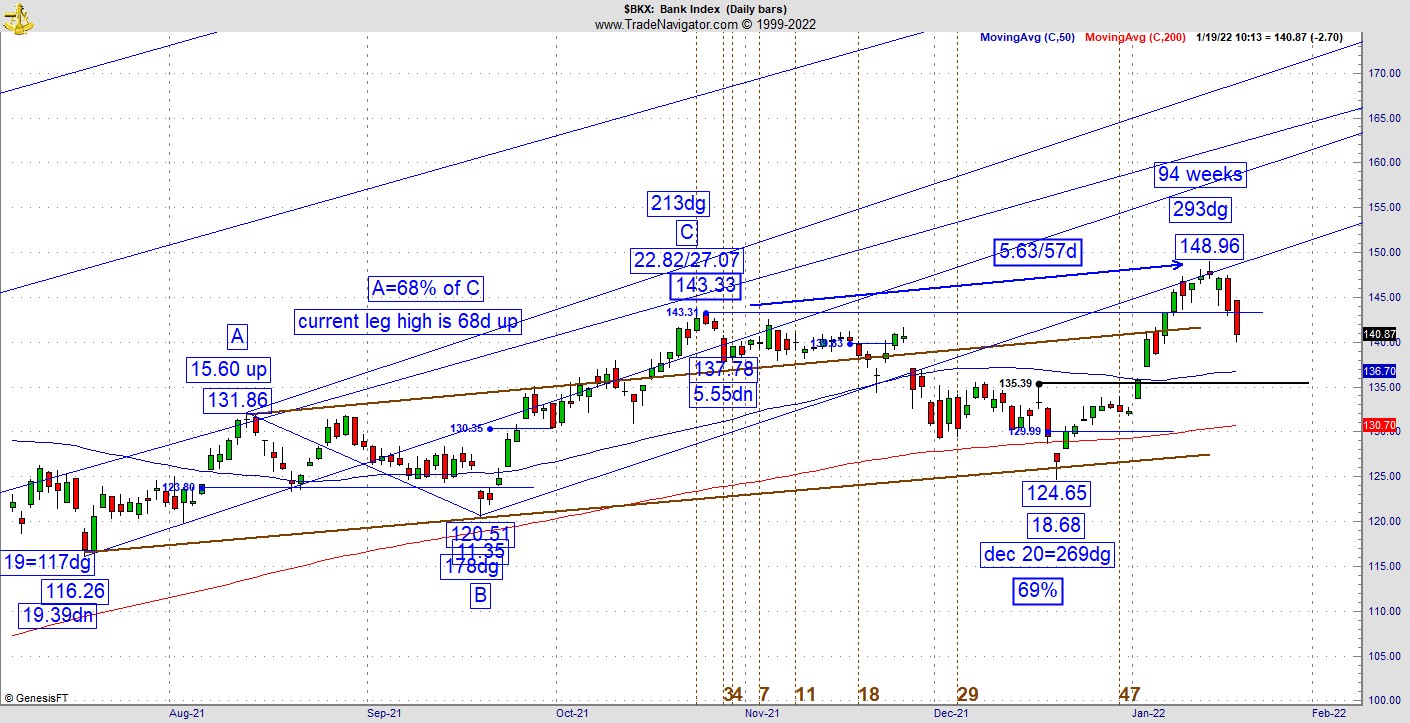
The KBW Nasdaq Bank Index (BKX) is no longer complacent about this. We’ve been tracking this one if for no other reason it is a chart with a beautiful set of square out vibrations that has enabled it to get to yet another new high. However, we have some near-term vibrations which could spell trouble at least in the near to intermediate term. The BKX peaked on January 13, which is the 293dg day of the year. As it turns out, this is roughly 94 weeks from the bottom in March, 2020. In the near term from the prior high the difference is 5.63 which doesn’t mean much by itself until we realize its 57 days. Perhaps most concerning about this chart is the fact Wednesday’s action breached the prior high in October which means a clean polarity flip where former resistance becomes support did not happen. There was a gap up on January 4. At this stage of the game, it’s a reasonable projection to see the price action drop at least to that point which is around 135.
Most people will tell you the pattern won’t be in any technical trouble if it stops going down at 135, simply because it will not have broken the progression of higher highs and higher lows. Banks are not in trouble yet, but its highly likely everything will start getting into trouble if the Ten-Year breaches important support levels just discussed. What we have right now is enough vibrational trouble to at least turn the pattern from up to sideways.
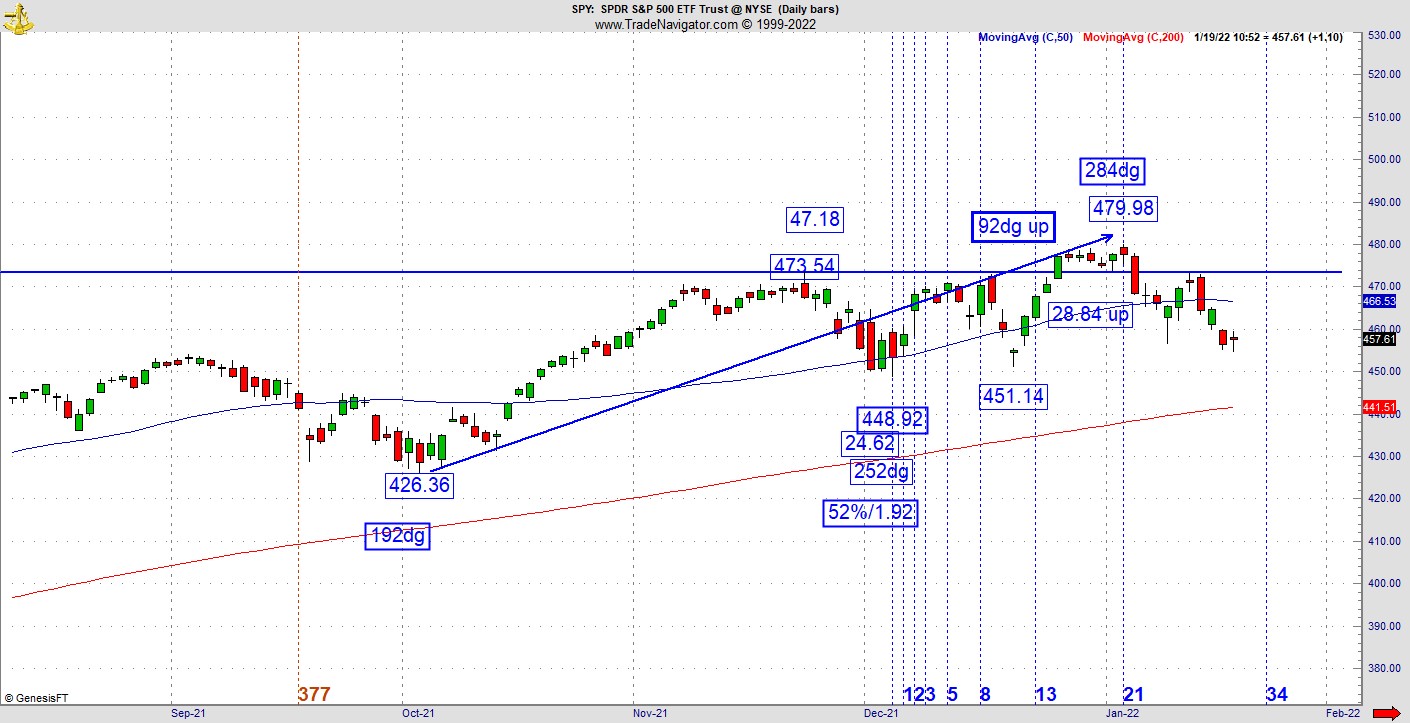
Finally, I was messing around with the Gann calendar aspect of the S&P 500 ETF Trust (SPY) and found some interesting near-term readings.

October 4 was an important low which just so happened to be the 192dg vibrational day. The high came in on January 4, which is the 284dg day of the year. That’s significant because its 92dg up from a 192dg low after we had an interim low at 448.92, which had a slash line (retracement values) of 52% and 1.92. Then its also 94 weeks up, right? For those who don’t know, we measure retracements like everyone else; but also the inverse, which is the bigger leg against the smaller leg. That’s how I got the 1.92. Overall, these readings have been good enough to get us off the high and while we don’t have lower lows, there is a lower high. No technical damage yet but it’s getting too close for comfort.
This is the bigger picture; the Fed has declared a new interest rate environment for 2022 and beyond. If I don’t know anything else, I believe its time to a have a different bias on the market. For most of the past decade I would encounter people who, at selected times, decided to go against the Fed’s easy money policies. Some who went short either in 2015, at Brexit, or the fourth quarter of 2018 got burned really bad and did not recover. I would ask these people why go long-term bear against the easiest money policies in the history of the republic. The people I talked to weren’t even aware they were going against the stream. Now we have a complete flip in the script.
Are you going to remain longer term bullish in an inflationary, rising rate environment? If you are, do you believe the economy is going to be strong enough to absorb the higher cost of capital? Our first real test will be if and when the Ten-Year breaks down from these levels.
Finally, we’ve talked about Kim Githler’s speech at the 2018 Vegas Traders Expo several times in this space. That was the last time the market feared the higher rate environment. The point is most of the people in the ballroom had under five years of experience and only a handful of people were able to admit they were short as the Dow was getting crushed that week. Many intermediate level traders are either good at being bullish or bearish but not both. If you’ve been bullish most of the past decade, its time to learn how to short the market. Most important, when you look at a pattern, don’t only consider that it will continue going up. For those looking to go from intermediate level to the cusp of mastery as a trader, one will have to become comfortable going the other way. Certainly, none of us wants to see a new brutal bear because of the social implications. Aside from that, you should not care which way the market goes as long as you can be on the right side of it.
The biggest shift for most people is being willing to consider looking at the market from other side of the coin. In the very least, once you start seeing the progression of higher highs and lows become violated, this is a sign that being long might cause you to be on the wrong side of the market.
For more information about Jeff Greenblatt, visit Lucaswaveinternational.com.


