

Today (among other things) I’m going to share a trick of the trade for how to be on the right side of the market, explains Jeff Greenblatt of Lucas Wave International.
The example we are going to use is a chart we’ve been following here for weeks and months. It’s the Bitcoin (BTC) chart and the recent pattern is one of the best teaching examples I can find outside of all the training materials I’ve produced over the years. We are also going to look at the pattern coming into the week and how it played out thus far.
All I’m going to say about the Fed is there is a reason they are called The Creature from Jekyll Island. Everyone has figured out they are hopelessly behind the curve when it comes to inflation. On Wednesday, we learned they are working on the taper while everyone still believes the first-rate hike is coming in March at the seasonal change point.
Without me having to talk about this every week, if you really want to understand what is going on not only in financial markets but geopolitically, I recommend the following four books. In terms of financial books, The Creature from Jekyll Island by G. Edward Griffin, which is a serious study of the creation of the Fed in 1913. Then, we have The Dollar Crisis by Richard Duncan, who is one of the most reputable economists I’ve run across simply because he has no normalcy bias. Then, if you want to understand true geopolitics, read The Trigger by Icke. There is overlap with The Creature from Jekyll Island and The Trigger. They cover different aspects of the same history.
You read these books and you’ll come to the realization your deeper understanding of a price chart pattern is your only salvation in navigating financial markets in the Fourth Turning era. The Fourth Turning by Neil Howe and William Strauss is one of the best studies of long-term cycles and you can see how accurate it has been. That’s my fourth recommendation.
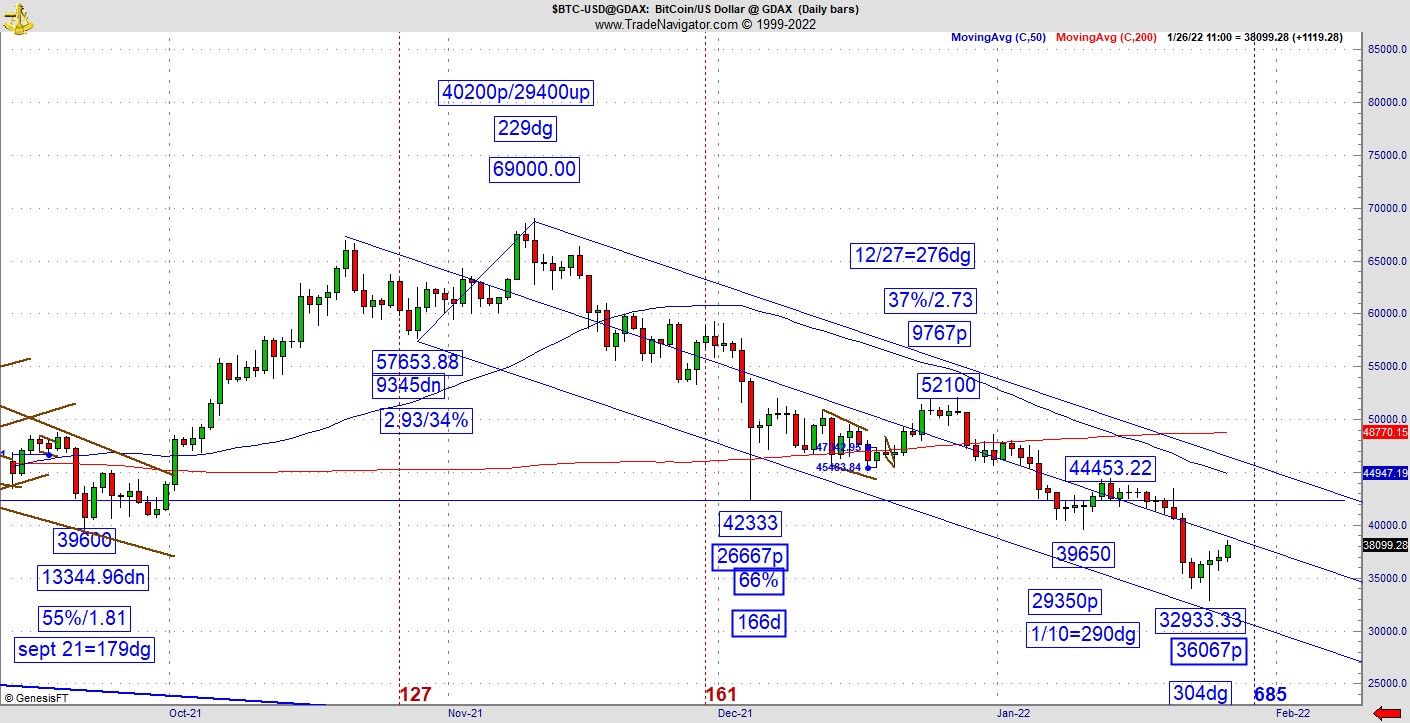
That being said, we tracked Bitcoin as it manifested one of the best vibrational square outs I’ve seen in the seven years I’ve been doing this type of work. At 26,667 points down, a 66% retracement, and 166 days off the low, this is a pattern that should’ve went to the Moon. But it didn’t. Many people told me every reason why Bitcoin should be much higher except for the most important. Everyone loved Bitcoin but the pattern didn’t love them back. I knew it would make that breakout attempt, but it failed. Then I told you if that great looking low was violated, it would have an important drop. Support broke and it dropped another 9,400 points! Now, I’m satisfied that worked out successfully.
The next question is how far would it fall? The answer was until it found a vibration it liked. You can clearly see it made it near the low end of the Andrews channel, so it came to a place where it logically should be bouncing. But here’s what happened. On Monday, it started putting in a lower tail. That was interesting, so I put on my detective hat to find out it was down 36,067 points. I’ve been talking to you about replication in this space for nearly a year. With another 67 vibration at the low, I knew this one had a chance. So, if you are a major crypto bull, here’s your chance and it could be your last chance. Yeah, it’s up three days but it’s not out of the woods by any stretch of the imagination. This is highly likely going to test that breakdown to determine if former support becomes long-term resistance. The entire future of Bitcoin and possibly much of the crypto world will depend on how the test of the 42,333 area goes.
So, what is my revelation to stay on the right side of the market? One can never always be on the right side because in tight trading ranges, markets get very cloudy. But, if you can put a hole in the roof (like they used to have at Texas Cowboys Stadium) and get some clarity, you can be on the right side much more of the time. All you really need is one good sequence. One of my most important revelations is when a really good vibrational reading like we saw on Bitcoin earlier is violated you probably shouldn’t immediately stop and reverse, but you should look to capitalize on the next pivot. What that means is if you see something like the Bitcoin 66-67 vibration get violated, scale down and look to sell the first decent bounce you can find. Then do as you see here, have an awareness of the character and quality of a change of direction when you find it. Why is this important? Because the same thing you see here on a daily Bitcoin chart is manifesting on time frames down to a one-minute on anything you might be trading. I’ll look to find you a good example of that in a smaller time frame for next time.
Over the weekend, I was surveying the market to see if and when it might stop going down. One of my students, who is a fan of the S&P 500 ETF Trust ETF (SPY) and S&P 500 (SPX), helped me stumble into the following reading. Going back to the low in October, that low on October fourth was a 192dg vibrational day on the Gann calendar. As it turned out, the next low on December third was the 252dg vibrational day. This will become important in a few minutes. The high on January fourth was a 284dg vibrational day.
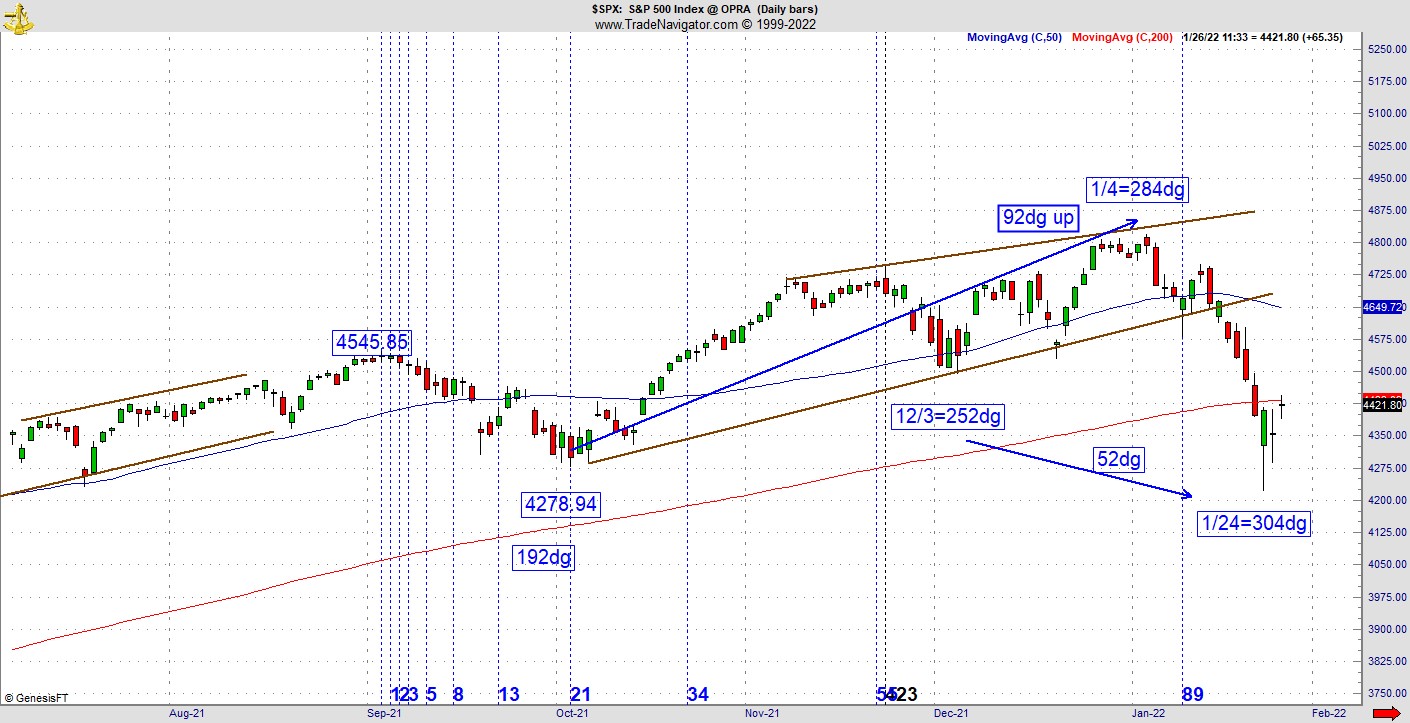
That means the recent rally in the fourth quarter was 92dg up from the 192dg vibrational day. This was last Saturday, and we were trying to figure out when the market might stop going down. We came to realize that Monday, January 24 was the 304dg vibrational day for the year. That meant it was possible to get a turn at 52dg from the December third low at 252dg. You just saw how this tendency created the high. Wednesday was the third day off the low. The initial kneejerk reaction was higher prices. Dow futures immediately rose 264 points in less than four minutes, but gave it back. This is not surprising given the set up for the low that we just discussed. This low is decent looking but not ironclad. Let’s see what happens when these patterns push closer to overhead resistance and recent breakdown levels.
We could very be in the same position at Bitcoin. This reading isn’t as powerful as the prior low in Bitcoin but if this pivot fails, we could see a serious drop. As you can see right now, this pattern is wrestling with the 200-day moving average. Taking this one step at a time, a failure to hold Monday’s low means the SPX could find next support near 3,700, which is pattern support. At this moment, the 200-week moving average is 3,352. You know my longer-term view, if it’s going to drop, 2022 is the year for it. If you are looking for a serious market reaction linked to the Fed, the meeting in March should provide the fireworks some of you are looking for.
For more information about Jeff Greenblatt, visit Lucaswaveinternational.com.


