

Imagine you held a party, and nobody showed up, states Ian Murphy of MurphyTrading.com.
The S&P 500 (SPX), Nasdaq (NDX) and Russell 2000 (RUT) are all trading at their -3ATR lines on a daily chart and failed to rally after Monday’s reversal bar, it feels like the bulls threw open the doors and no one attended.
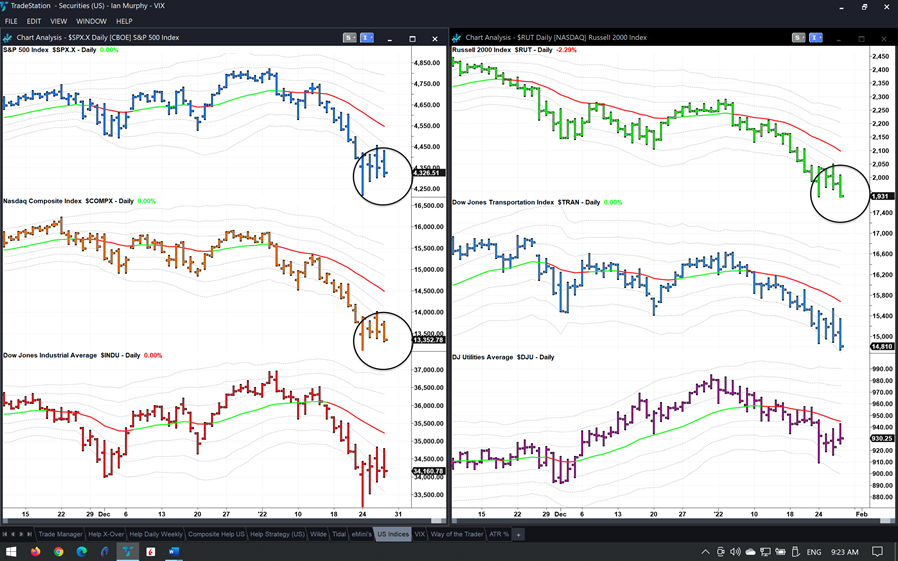
The failure of the main equity indices to bounce from this oversold condition for three days in a row confirms an abundance of supply coming in when prices rise a little (circles).
Most retail traders only trade on the long side, so frustration is growing for those sitting in cash. Many have taken a hit by catching the proverbial falling knife in anticipation of a reaction rally. We should remain patient and continue to look for concrete signs the trend is changing to the upside rather than anticipating the change.
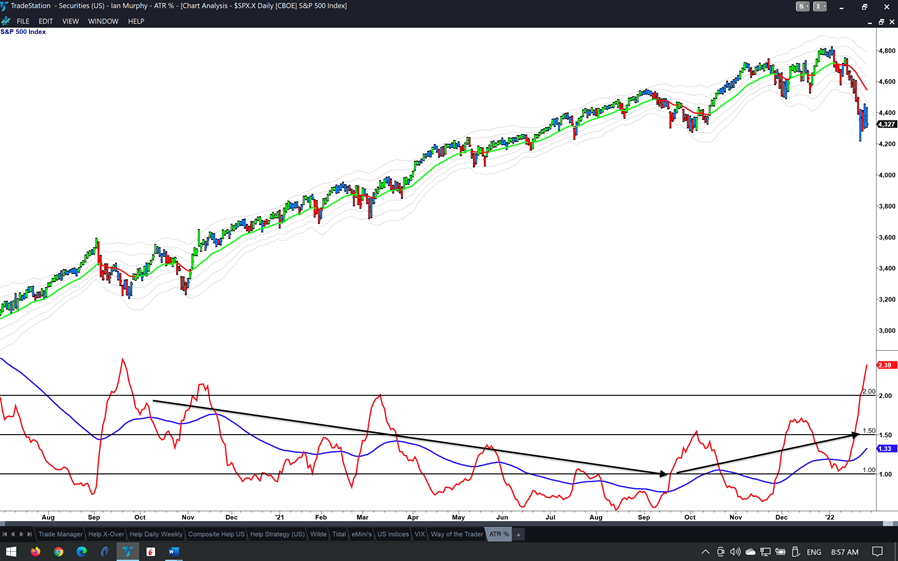
Realized volatility as measured by Average True Range Percent (ATR%) is one of the signs I look for to confirm a trend change. ATR% rises in bear markets and falls in bullish trends. Notice how a 63 period EMA of the 13 period ATR% on a daily chart trended down throughout last year’s bull market but has risen steadily since last September (black arrows). The 2% level is important because minor pullbacks reverse when they hit 2%, that has not happened this time.
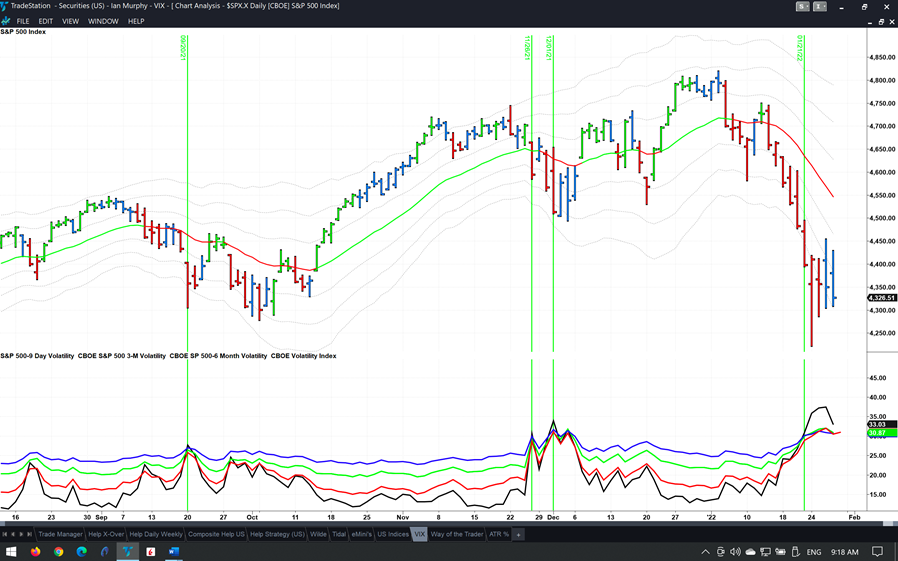
As the markets continue to sell off, a few queries have come in about shorting and specifically the CBOE SPX Volatility Index (VIX) strategy. The current trigger from January 21 is still active and I’ve updated the video on this strategy in Module 22 of the Online Trading Course on the Education page of the website. This is still a work in progress, and I am not trading these triggers.
Learn more about Ian Murphy at MurphyTrading.com.


