

I recently recommended an options trade based on pharmaceuticals giant AbbVie (ABBV) based on expectations that the stock could break out of its current trading range after its earnings release on 2/02/22, notes Joe Duarte, technical specialist and editor of In the Money Options.
AbbVie: A Big Pharma Blue Chip Stock that Could Dazzle Post Earnings
I honestly wrestled on whether to recommend the stock versus an option because the price chart is so interesting. But at the end of the day, the risk manager part of my brain got the final vote, so I went for the option. And here’s why: it’s pretty simple actually. The market is still very dicey, which means that if the entire market rolls over, the risk of loss is higher, regardless of how good a company is. A call option, on the other hand, offers a great way to participate in the upside potential for the stock while limiting the loss to the purchase price of the contract.
Now, why do I like ABBV so much?
First—the company has been firing on all cylinders having beaten expectations handily in Q3 while raising its full year’s guidance. And second, while the market has cratered of late, the stock has held up quite well. Of course, there are no guarantees that ABBV will beat its earnings. And no one knows what the market will do even if it delivers a sterling earnings report and offers more upbeat guidance. But, as far as we can tell, the stock is currently in strong hands, which is very encouraging.
Digging deeper into the price chart, we can see encouraging indicators as well. Specifically, Accumulation Distribution (ADI) has been moving higher of late and has not broken down in a tough market. On Balance Volume (OBV) is very strong which, means that expectations are high for a big post earnings move. And Volume by Price (VBP) suggests that if the stock can move above $140 decisively it could run for a while.
The bottom line is that in this market there are still stocks worth considering on the long side while at the same time options can offer more risk averse ways to participate.
Market Breadth Is Bruised but May Recover in the Short Term
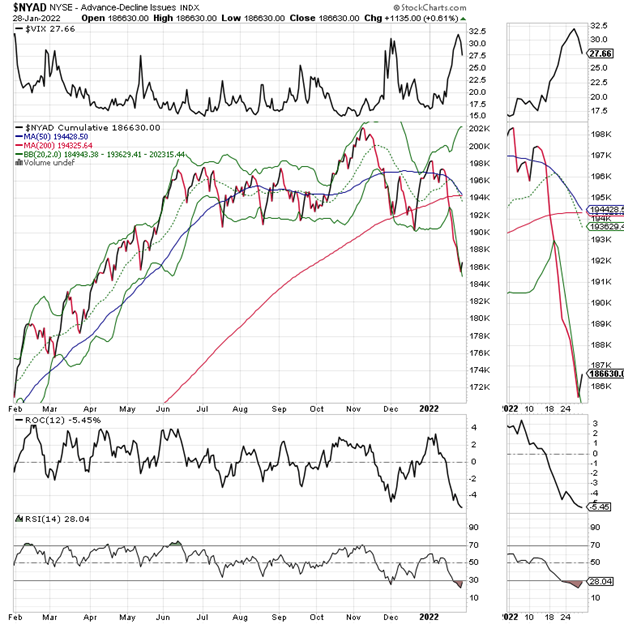
Another week and we saw yet another new low in the New York Stock Exchange Advance Decline line (NYAD). Yet, as we saw with Friday’s late day rally, it is possible that the sellers are nearly exhausted. This was suggested by the decrease in the COBE SPX Vollitility Index (VIX) on Friday, which coincided with a rebound in NYAD and the major indexes.
Certainly, NYAD is now well into bear market territory having broken decisively below its 200-day moving average. And since it is well oversold, as illustrated by the RSI residing well below 30, the odds for a bounce are fairly good. Of course, the key is twofold: how good a bounce we get and how long it lasts.
Remember that a rise in the VIX signals that put option volume (bets that the market is going to fall) are on the rise. What follows when put volume rises is that rising put volumes cause market makers to sell puts and simultaneously hedge their bets by selling stocks and stock index futures. Of course, the reverse is true, which is what we saw Friday afternoon. Now, if the current trend continues, we may be out of the woods for a bit. But, I’m not getting my hopes up too much on this.
So, what would make this trend reversal last? One thing would be that put volume continues to decrease so that the market makers can ease up on their selling. The other, and this would be even better, would be that actual call buyers return to the market so that the process can be reversed.
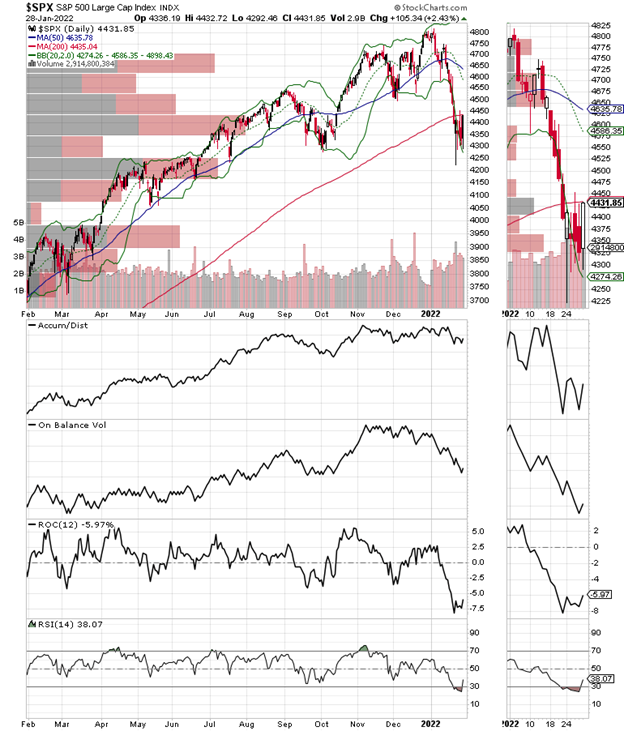
Meanwhile, the S&P 500 (SPX) turned up and closed just below its 200-day moving average, with both Accumulation Distribution (ADI) suggesting that the short sellers are giving up for now and On Balance Volume (OBV) suggesting that a smattering of real buying came in. A further improvement in these indicators with a decisive move above the 200-day moving average would be a bullish short term development.
The S&P Small Cap 600 index (SML) also remained well below its 200-day moving average.
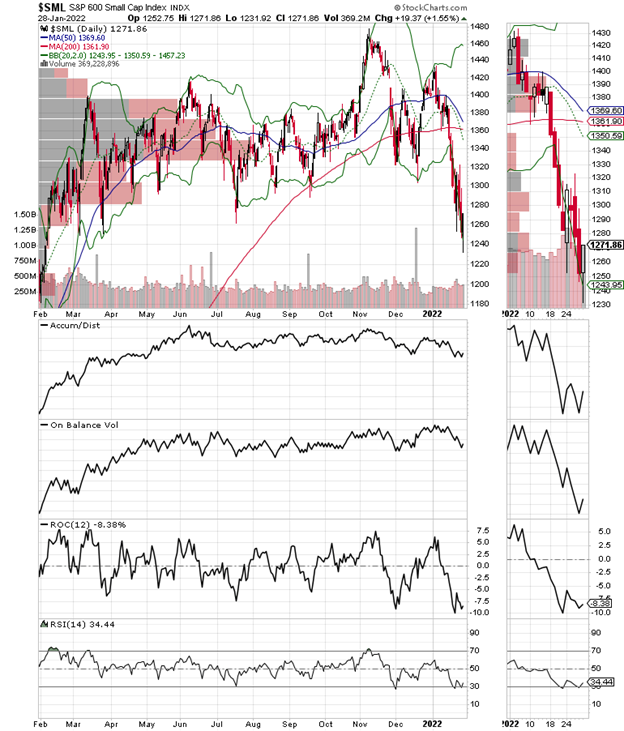
The S&P Small Cap 600 index (SML) also broke well below its 200-day moving average. And although it’s clearly oversold, it could move decidedly lower.
To learn more about Joe Duarte, please visit JoeDuarteintheMoneyOptions.com.


