

Where to now? Where is the "pain trade" after a 12.5% correction followed by a 7.2% recovery rally...all during the month of January, observes Mike Paulenoff of MPTrader.
My four-hour Emini S&P 500 (ES) chart contains a lot of information that can help guide us in our quest to answer the question, “Where is the pain trade from here?” In other words, in which direction will the most mal-positioned traders get hurt?
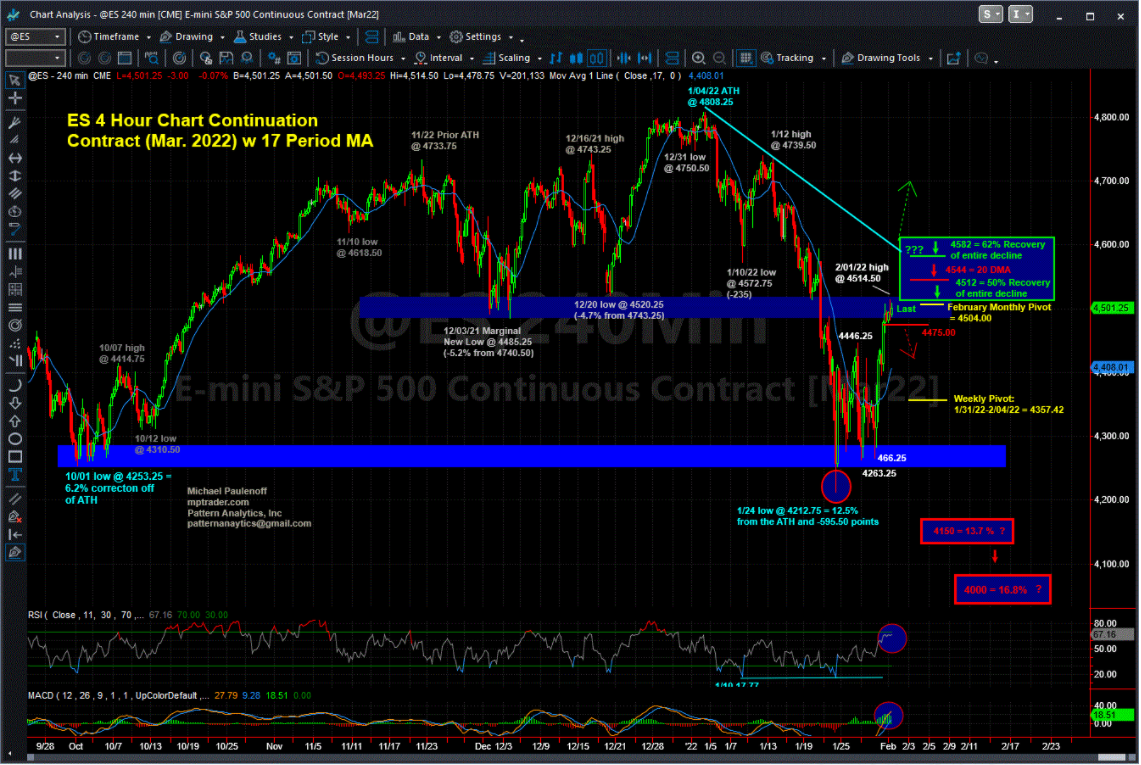
For starters, from a nearest-term perspective, unless and until support at 4475 is violated, the bulls will remain in directional control of the advance off the 1/24 low at 4212.75.
Barring a sustained breach of 4475, which does not appear to be happening just yet, meaning that the pain trade is still higher, ES is poised to grind higher into a "resistance rich target zone" from 4512—the 50% recovery of the entire January decline—to 4544, which is the sharply declining 20 DMA. And from there to 4582, the 62% recovery of the entire January decline and the coordinate of the dominant resistance line from the ATH at 4808.25.
If ES manages to chew or rocket through resistance lodged from 4512 to 4582, then it will be positioned to make a run at the ATH-zone of 4740 to 4808.
My sense from my pattern work suggests that within the next few trading hours, ES will peak and roll over from the vicinity of the sharply down-sloping 20 DMA, now at 4544.
Thereafter, depending either on the form exhibited by the initial decline from "the recovery high," say at 4540, or a decline from 4540 down through 4500, we will get our first indication of whether or not the bears have reasserted directional control.
Mike Paulenoff is co-founder of MPTrader.com, a live Trading Room featuring his analysis of equity indices, commodities, cryptocurrencies, and trending stocks and ETFs.


