

You need no further proof of that. All you must do is consider my bearish bias for this year and observe what has gone on over the past week or so, explains Jeff Greenblatt of Lucas Wave International.
This is an important lesson for people considering 90% of the crowd lost 90% of their capital when the old internet bubble popped. As you know, I look to 2022 as a year that has a high probability potential of manifesting the perfect storm, whatever that means.
That doesn’t mean it goes straight down. January gave us a thrust down right from the start. But with all these problems picking up steam as the calendar rolled into February, we find the market coming back up. How do we explain that? Gerald Celente believes it’s the plunge protection team in action. I think there is some of that going on, but I look to my vibrational square outs and the condition we talked about last week in the S&P 500 (SPX) and the S&P 500 Trust ETF (SPY) has gained traction.
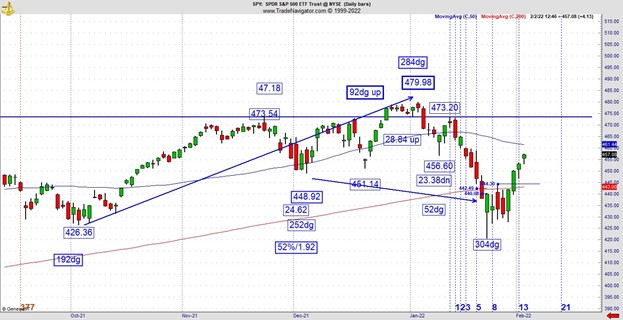
As you know, this chart has been dominated by the 92 and 52 vibrations dating back to October. It did it again last week as the low hit perfectly at 52dg from the last rally low on December 3. For it to have any chance at surviving, it had to make that left turn above intraday pattern resistance. As you can see, it did that. So, an innocent little vibration on the Gann calendar has stopped the bleeding and allowing some testing of the January breakdown.
In terms of Bitcoin (BTC), I was even more bearish, but last week shared with you my bias changed. I’m not here to pour cold water on everyone’s crypto party. Believe me when I tell you the people who’ve invested in instruments like Bitcoin view it with a passion that almost borders a religious spirit. Yeah, they tell you every fundamental reason why Bitcoin should and will be going much higher. Nevertheless, important support was violated. Nobody paid much attention to it. In my technical world, a breach that was the lower probability materialized and the pattern dropped an additional 9400 points before getting a bid.
They would ask how low can it go? I don’t know, I’m always on the lookout for a reaction that could change the landscape. In Bitcoin’s case this actually happened on January 24 when a chart that had been dominated by the 66/67 vibration found a low at 36067 points. I knew immediately this could mean something.
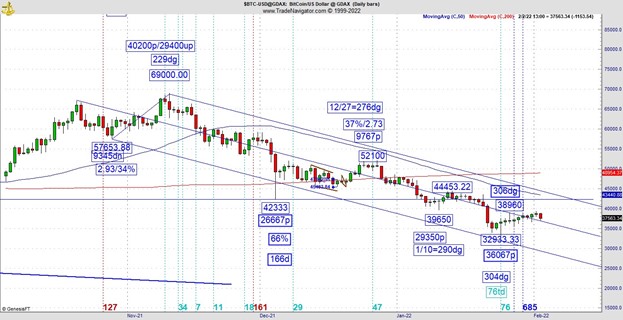
Let’s be clear, not all pivots are created equally. The pivots that have replication have a greater chance of surviving and ultimately thriving. So here are a couple more reasons why Bitcoin found that low. On December 27, the pathetic bounce off the December 4 low terminated and it turned out to be the 276 vibrational days of the year. At the low, this chart was 76 trading days down. I hope you don’t think that’s a coincidence. If there is anything that can possibly be considered longer-term bullish for this chart, consider the following.
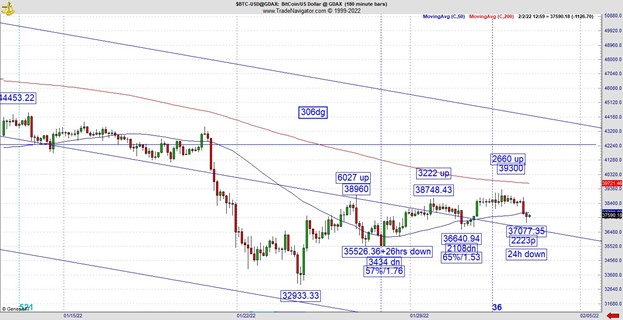
The high back on November 10 was the 229dg day of the year. The early high in this developing bounce was on January 26, which was the 306dg day of the year. That means it was 77dg off the top. The high that day was 38960 and it could’ve rolled over right there. Instead, it made a slightly higher high. I’ve included an intraday as well. I did the readings on an hourly but to fit in on one chart I’m also showing the 180 minutes. This is not the greatest vibrational setup as compared to many other patterns bouncing off lows. Notable is the first secondary low at 35526.36 at 26 hours down. Finally, the latest low on Wednesday is 2223 points down in 24 hours. There’s not a lot of symmetry here so I’ll continue to look no further than a retest of the breakdown.
My projections still call for a polarity test of the breakdown near 42300. If it could survive all that, it’s time to get bullish again. The takeaway here for the short term is that it had a chance to fail after the 38960 high but didn’t, which could be the first sign the behavior of this market has changed.
There are many ways to lose money in financial markets. Potential traders fall out of this business for two main reasons. Either they get caught with a massive loss that it’s impossible to recover or they suffer what amounts to a thousand paper cuts. It’s okay to get stopped out and lose small but if you never figure out why there are excessive stop losses, you’ll never get ahead and eventually temptation and emotion takes over.
One of the best ways to overcome this obstacle is to be able to adapt and change your bias when the market calls for it. That may mean overcoming pride and wanting what the market wants. The market doesn’t care what you or I think. That being said it will reward you handsomely if and when you can get into a flow state with it. Its’ extremely hard to stay in a flow state, one can only do it for certain stretches of time. But the more you can do it the better off you’ll be. Getting back to that SPX/SPY chart, should you have gone long right at the 52dg low? The right answer isn’t what you think. It’s going to depend on your own personal tolerance for risk. A week ago, Monday, when the market bottomed, nobody knew if it could stick. For those who really understand what they are doing, one could’ve tested the waters with a small experimental long position. For the rest who are not so aggressive, its best to allow a secondary to form.
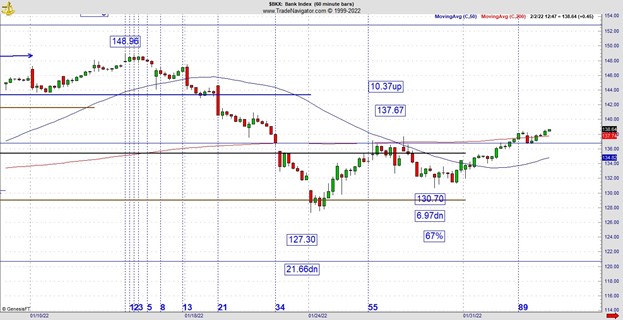
Here's what that looks like. I found a notable example on the banking chart. As you know, I got fairly bearish on the BKX. But look at the hourly. There was a drop of 21.66 points. Then it formed a secondary low at a 67% retracement. We have excellent replication here along with a good reading that created our secondary low. This is a better setup than the secondaries on Bitcoin. If you were a SPY trader, its perfectly fine to find your secondary on another important chart like the BKX. How far does it go? It has now survived a gap down from January 21. It will go until it has a good enough reaction to change the bias. That could materialize today or a month from today.
The takeaway for today? Markets can and will do whatever they want, whenever they want. They usually revert to chaos, meaning it seeks to form order in the disorder and just when you think it can’t change direction, it will. We need to have serious trading strategies we trust to recognize reactions when we see them. It doesn’t matter which way the market goes as long as we can recognize and ultimately get into a flow state with whatever it is doing. Maybe the crypto people will be right after all. But the bigger picture has not revealed itself yet. If you already believe it’s going much higher without supporting evidence, you might be gambling. That’s a discussion for another day.
For more information about Jeff Greenblatt, visit Lucaswaveinternational.com.


