

I have written several articles on the use of Nasdaq-100 Volatility Index (VOLQ) to establish a trading range for Invesco QQQ Trust (QQQ) when writing our option contracts, states Allan Ellman of The Blue Collar Investor.
Many members of our BCI community have inquired about a more universal application using implied volatility (IV) stats to accomplish similar results for all stocks and ETFs. The answer is yes, and this article will use a real-life example with Copart, Inc. (CPRT).
Initial Stats and Strategy Procedure
- 7/19/2021: CPRT trading at $140.15.
- Use standard IV stats to determine an annualized projected price movement based on market option pricing.
- Convert that annualized IV stat into one specific for the current option timeframe (days to expiration or DTE): 32 DTE.
- Calculate the projected price range based on the IV specific stat.
- Check the option-chain to see if we can generate a premium that will bring the breakeven down to the low end of the range while still generating enough time-value premium to meet our goals.
Implied Volatility of CPRT on 7/19/2021: 20.23 (www.ivolatility.com)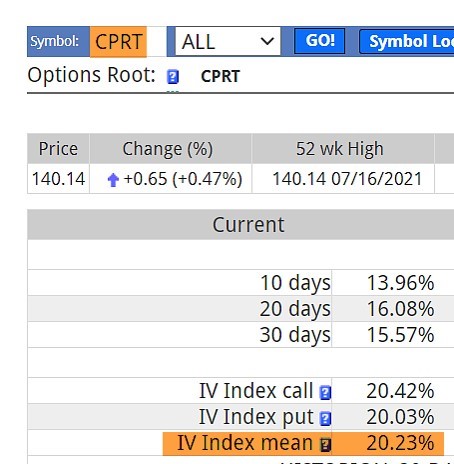
CPRT: IV on 7-19-2021
Converting the Annualized IV Stat to a 32-day IV Where the August 2021 Contracts Expire on 8/20/2021
- The formula we use is: Annualized IV/ (Square root of 365/DTE) = 32-day IV for CPRT.
- 20.23/Square root of 365/32) = 20.23%/3.38% = $4.74 higher and lower than current market value.
- The projected range during the August 2021 contracts is $135.41–144.89.
- Next, we view an option-chain to see if we can generate a minimum premium of $4.74 which will both bring us down to the low end of the range ($135.41) and also have a time-value component that will meet our strategy goals (10%–15% annualized, as an example).
Option-Chain for CPRT on 7/19/2021
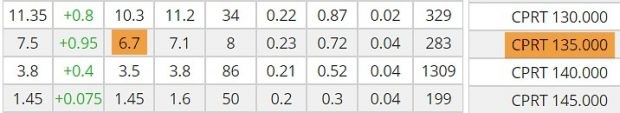
CPRT: Option-Chain Data on 7-19-2021
Our objective is to generate at least $4.74. The $140.00 strike falls short ($3.50), and the $135.00 strike is more than we require but will more than suffice if the time-value requirement meets our goals. Let’s calculate using the BCI Elite Covered Call Writing Calculator/multiple tab.
CPRT: One-Month Calculations for the August 2021 Contracts
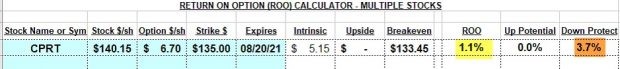
CPRT Calculations Using the BCI Elite Covered Call Calculator. The calculator shows a one-month initial time-value return of 1.1%, 32-day return, 12.5% annualized which does meet our goal range of between 10% and 15%.
Discussion
A reliable projected trading range can be calculated using implied volatility stats and a conversion formula. When we have a low-end of the price range breakeven met by selling call option premium while still having a time-value component that meets our goals, we will have created a low-risk/high reward approach to option-selling.
Math Revision
The formula for the expected trading range using IV is shown in the screenshot below. In the case of CPRT, the 32-day IV is [(20.23) x (sq.root of 32/365) = 5.99%.
5.99% of 140.15 = an expected price movement of $8.39 in both directions as shown in our BCI Expected Price Movement Calculator:
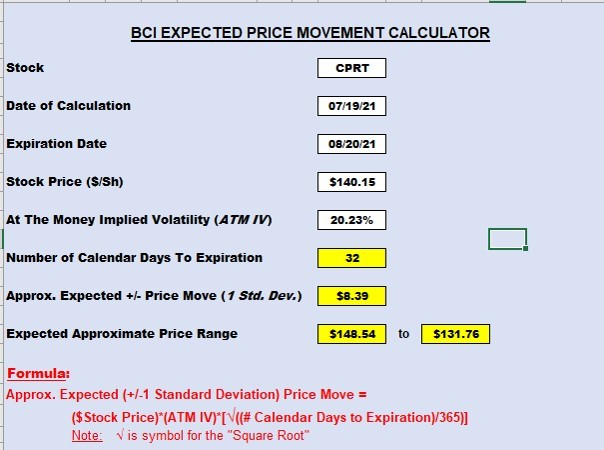
CPRT: Expected 32-Day Trading Range
Learn more about Alan Ellman on the Blue Collar Investor Website.


