

Market participants are speculating whether 2022 will be good for stocks or not, notes Jeff Greenblatt of Lucas Wave International.
We are in the very same position concerning Bitcoin (BTC). Readers of this space know we’ve tracked this chart for weeks. Aside from the moneymaking aspect, this has been an interesting chart to follow because of the numerous emotional turns we’ve experienced over the past year. It seems these turns are more emotional because some people view crypto as more than just an investment. As I’ve told you in recent posts, the Bitcoin people I talk to can’t imagine the possibility of it heading south.
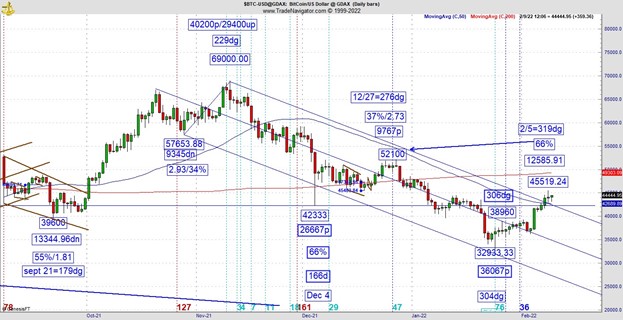
That’s dangerous on many levels, as people seem to have forgotten the lessons of 2000 and 2008. Whatever the case, the recent action has rallied right up to the anticipated point of retesting the breakdown. I’ve been taking this one step at a time, staying bearish until there was a reason to change, and change it did. The change came on Jan 24, when I identified the 66/67 replication at the low which was down a grand total of 36067 points. There was also a 76 vibration where the last drop commenced on a 276dg vibrational day on the Gann calendar, and I realized a few days later it was also 76 trading days down.
That being said, we needed to see a test of the breakdown point. This became a very high probability after it took out the 306dg day (76dg off the top). Once that was accomplished, the last bearish obstacle was removed, and we are getting a serious test of levels the pattern has been wrestling with since December fourth. This pattern is not out of the woods yet, but the bullish case in terms of pure technical analysis suggests the breakdown snapped back quickly. Oh yeah, the first few days off the low the price action melted up as a result of no more bears. They could be waiting at this level, right? The action is sitting right at the top of the Andrews channel right at the point of the breakdown. At this stage of the game the February eighth is a 66% retracement back to the December 27 pivot which started the breakdown. There’s our replication again. Here’s a few observations from someone who has seen thousands of these types of setups. The 66% would be more powerful if we were talking about a retracement of the entire move, not just a portion of it.
We’ve already had three prior instances of the 66/67 vibration all work. It’s like anything else, at some point a specific condition or signal stops working because they weaken over time. This small high formed Tuesday. If it truly were dropping, it missed a great chance to do so on Wednesday morning. With the information we have now, the pattern is starting to lean bullish. That’s fine and nice, but odds for the bulls will start to increase if and when Tuesday’s high is taken out.
A couple weeks back, I told you a very high probability way of being on the right side of the trend, even if its just for stretches at a time. The Bitcoin failure to hold the initial excellent vibration on December fourth led to a 9400-point drop. Here’s an example of how this can work on everyday or intraday charting.
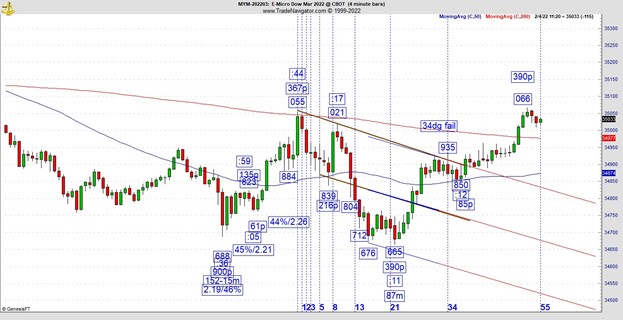
This is a Dow futures (YM=F) chart. There was a decent intraday shorting opportunity, which works the majority of the time, but not always. From the high it was 34dg on the intraday clock at a price of 34935 (935 on the chart). The candles and trend line suggested a bear play could work here.
But it didn’t. We don’t always have dramatically interesting readings like we saw on that December fourth Bitcoin vibration. That was a spectacular failure. This one was run of the mill. The lesson here for those who are starting to understand how Gann price and time vibrational bars work is if something jumps off the page and fails, it means something bigger is coming from the other direction. In this case it produced a whole thrust higher. This one made it all the way to intraday pattern resistance. How to deal with a condition like this? The emotional impulse might be to stop and reverse once it clears above 935. That could work, but it could also blow up in your face. I believe traders get into trouble when they try to get back the loss all in one gulp. You could stop and reverse, praying it doesn’t come back on you. The other possibility is biding your time and getting another pullback going in the new direction.
Trading is not easy, even when you have an edge. In this case, you’ll see the pattern dropped 85 points while at the same time the low to low from the 665 pivot was 185 points. That’s another tendency which works much of the time. Please understand back testing is useless when it comes to nonlinear math/chaos theory-based methodologies. As people we are imperfect, we aren’t getting right all the time. I’m here to tell you its possible I could’ve seen that 85-vibration line up at the low, but I had already made my mind up to take that 34 vibration, so I stayed with it until I was stopped out. If I wanted to be long, I’d have to look for vibrational pullback bar. In other words, I’d rather the pattern reset itself as opposed to me piling in on a stop and reverse.
So, if you can’t back test a chaos-based methodology, what do you do? In recent posts, I’ve discussed Ericsson and his deliberate practice for mastery. You have to study a lot of patterns to be able to discern which way a pattern is likely to go based on experience. That’s the 10,000-hour rule and the road to mastery.
For more information about Jeff Greenblatt, visit Lucaswaveinternational.com.


