

Thus far, the market has done a decent job of bending but not breaking, states Jeff Greenblatt of Lucas Wave International.
It must be frustrating to bears to see the overall shape of the economic/geopolitical forces which act as a headwind yet don’t seem to make the impact some have thought it might to this point. We are experiencing conditions we’ve never seen before, yet the stock market refuses to break down. I’m not getting into all those situations here, but there is one condition the Fed has no control over which is about to play a much bigger role in what the market can accomplish this year.
Let’s talk about the Ten-Year Note (TNX). I didn’t write about it last week because I wanted to see how the weekly bar completed. The chart shows major support held in April, 2021. That low enabled us to draw highly accurate trend lines. The price action broke down from trend line support at the beginning of February. If that was all, it would be enough to sound the warning siren. But last week the price action also broke the 200-week moving average. It put in a lower tail which gave it the possibility (not probability) of recovering. But now you see the action from this week. It's not recovering. This chart shows the probability (not possibility) of dropping to the next level of trend line support at 121.
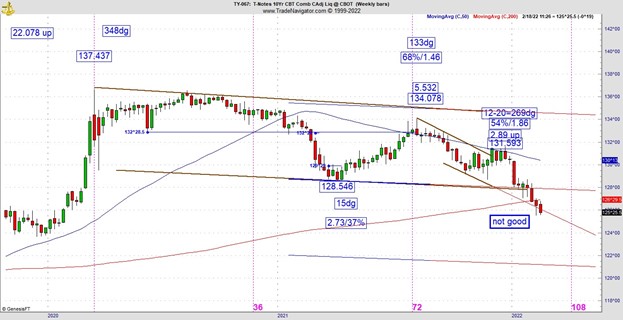
From where we are now, that’s only another 3.82%. There are different types of continuation charts. There is a daily and a weekly. I’m showing you the daily 067, but presented on the weekly, because of the mentioned support levels. The 056 weekly (not shown) broke down from its 200-week moving average in early January. The bottom line is both longer term Ten-Year Note charts are in serious trouble.
If you recall, I’ve mentioned the bulls weren’t very concerned about longer term rates and that would last until such time it started breaking down from support levels. As bond prices have dropped (rates rise) below important levels, the stock market has at least taken big intraday hits which means somebody is paying attention. The lower it goes; the more people will be paying attention. There are probably a few panic selloffs in our future.
Let’s get to one of our other favorite subjects, which is Bitcoin (BTC). What I’ve told you is we had a very nice vibrational square out at the low, and the next test would be the breakdown. From there, I told you it was likely to consolidate more but the evidence is starting to build on the bullish side. Social mood right now suggests when the rhetoric heats up in Ukraine, the crowd gets scared. When word came out a Russian invasion of the Ukraine isn’t about to happen, the crowd took a deep breath.
So, for now, one obstacle the crowd believes is a problem has been removed. Consequently, there was an interesting buy the dip that just completed.
The low on Sunday night was 41570, which was down 4285 points. By itself, that means nothing. But when we come to realize the low-to-low from the prior pivot is 84-180min bars. So, we are squaring out on a 180 chart where the pullback range (85) squares out with time at 84 bars. Let me be clear, I’ve shown you these types of square outs on the Emini/Emicro on intraday charts. This is the exact same concept but on a larger time frame.
Does that mean Bitcoin is out of the woods? Not yet. Let’s look at the bigger picture on the daily time frame.
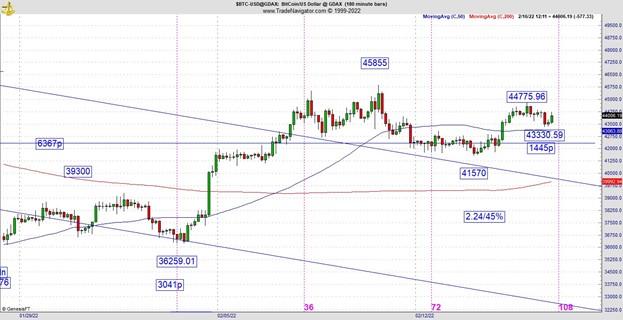
Even as the price action traced out a new higher high, it is still at a 67% retracement to the prior high in December. We now know about all the 66/67 symmetries, so here’s another one.
The challenge for traders is if they wait for the price action to pop high enough to change the retracement value, the risk-reward ratio would no longer be good. So, if you want to be long a chart like this, you either get more aggressive and take the trade on the 85 vibration as we’ve discussed, or you’ll have to wait and hope there is another pullback that has a good setup; and it looks like this could be materializing now, as the next pullback after the Fed minutes is 1445 points after the prior pullback was a 45% retracement. That’s good replication and becomes a buy on the 180 chart above 44249. No doubt about it, what I’ve shown you is a reasonable yet aggressive play.
Finally, I have one more example of what happens when the irresistible force meets the immovable object. I’ve shown you perfect intraday square outs on the intraday clock. Many of them work, some of them work for just a short time because something bigger is coming against them. Here’s last Friday’s Ukraine sequence.
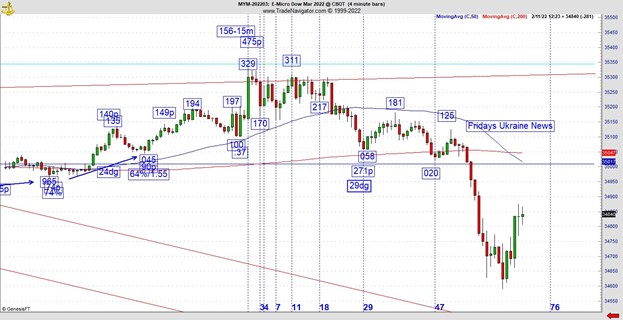
What nobody mentioned is the 35329 high terminated at 29 bars down. This still gave a thrust of 123 points, which could be a good day’s wage for those of you who trade Dow futures. But I’ve long told you one way of figuring out how to be on the right side of the market is ride a wave after one of these conventional square outs fail. This is one of the better examples I’ll find. Great square outs usually manifest into very fine moves. But when they don’t, chances are something bigger is coming the other way. So, as it broke the square out, the Ukraine news also broke. I didn’t always know about vibrational square outs.
In the old days when I was first starting, I used conventional Fibonacci time cycles, but the results were the same. The news event does not create the price action. It’s the setup that ends up manifesting in the news cycle. So, if you have a way of understanding the underlying price action, you’ll be rewarded when news events like last Friday manifests.
For more information about Jeff Greenblatt, visit Lucaswaveinternational.com.


