

The stock market attempted to rally last week but was unsuccessful. Only one of the eleven sectors rose, while the SPDR S&P 500 ETF Trust (SPY) was down -1.41%. Consumer Staples (XLP) and Materials (XLB) were the strongest, while Consumer Services (XLC) and the Energy Sector (XLE) were the weakest, states Bonnie Gortler of bonniegortler.com.
S&P SPDR Sector ETFs Performance Summary
2/11/22 - 2/18/22
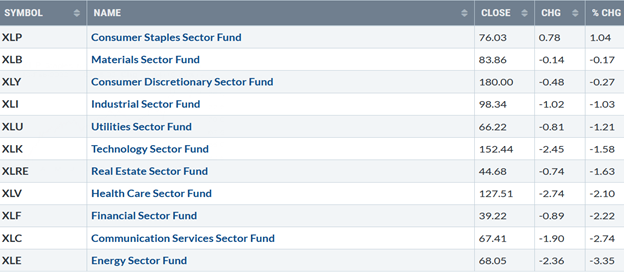
Source: Stockcharts.com
Figure 2: Bonnie's Mix of ETFs To Monitor
Performance Summary 2/11/22 - 2/18/22

Source: Stockcharts.com
Investors remain cautious, not interested in high-risk stocks, as geopolitical risks increased between Ukraine and Russia ahead of the long holiday weekend. Transports, Small Cap Value, and High Yield bucked the trend, and Technology lagged. The 10-Year US Treasury yields fell, closing below 2% at 1.932%. The upside channel objective remains at 2.7%. Five-Year US Treasury yields fell, closing at 1.82% near the highs of May 2010.
The major averages were lower. The Dow (DIJ) fell -1.90%, S&P 500 fell -1.58%, while Nasdaq (IXIC) dropped -1.76%. The Russell 2000 Index (RUT) weakened, down -1.03%, and the Value Line Arithmetic Index (VALUA) (a mix of approximately 1700 stocks) was down -1.10%, no follow-through to last weeks' gains.
Weekly market breadth worsened after showing some signs of improvement the previous week. The New York Stock Exchange Index (NYSE) had 1472 advances and 2101 declines. Nasdaq had 1916 advances and 3318 declines. There were 110 new highs and 735 new lows on the NYSE, and 153 new highs and 973 new lows on the Nasdaq.
Figure 3: CBOE Volatility Index VIX

Source: Stockcharts.com
The CBOE Volatility Index (VIX), a measure of fear, has been above average in 2022. VIX peaked at 31.96 on 1/26, slightly higher than the high made on 12/1/21 (blue circle). Volatility quieted early last week and then picked up as stocks weakened later in the week. VIX closed up slightly at 27.75 (orange circle) above support at 23.00 but remained below the 1/26 high.
Expect day-to-day volatility to continue if VIX remains above 20.00, and the market becomes even more volatile if VIX closes above the 1/26 high of 31.96. On the other hand, day-to-day volatility is likely to drop if VIX falls below 23 and then stays in a trading range between 18.00 and 20.00.
Figure 4: Daily New York Stock Exchange (NYSE) New Lows
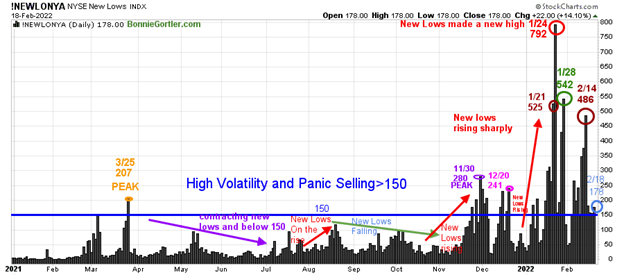
Source: Stockcharts.com
Watching new lows on the New York Stock Exchange is a simple technical tool that helps awareness about the immediate trend's direction.
New lows warned of a potential sharp pullback, high volatility, and "panic selling" for most of 2022, closing above 150. Learn more about the significance of new lows in my book, Journey to Wealth, published on Amazon. Here is an excerpt, "When new lows are above 150, the market is negative, higher risk, selling is taking place. Sometimes it could be severe, and sometimes on a very nasty day, you can have 'panic selling,' and big wild swings (high volatility) to the downside may occur."
As the market sold off in January, new lows rose sharply, peaking at 792 (red circle) on 1/24. New lows then narrowed to 542 (green circle) on 1/28 and began to contract—but not enough to be in a safe, low-risk zone. New lows rose in February, peaking on 2/14 at 486 (brown circle) but did not make a new high as the market fell.
On 2/18, new lows closed at 178 (light blue circle), closer to dropping below 150, a hopeful sign of a recovery in the future. Bottom fishing remains risky. Patience is required as long as new lows are above 150. On the other hand, it would be positive if news lows contracts below 150 for at least two days and then ultimately falls to between 25 and 50, indicating lower risk.
For now, the risk remains high as the bottoming process continues.
Figure 5: Daily Nasdaq Advance-Decline Line
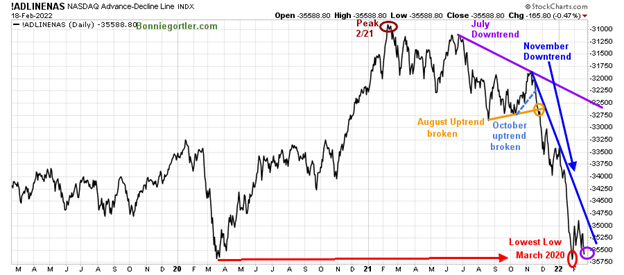
Source: Stockcharts.com
Market breadth on the Nasdaq remains in a downtrend in 2022. The daily Nasdaq AD-Line peaked in February 2021 (brown circle), followed by failed attempts to make a new high. After breaking the October uptrend (blue dotted line), the AD-Line made a series of lower highs and lower lows in November, December, and January. Two clear-down trends (blue and purple) remain in effect.
A bottoming pattern is developing, with the AD-Line making slightly higher lows than its March 2020 new low (red and purple circles). However, if there are more advances than declines this week and the AD-line turns up breaking the November downtrend (blue line), it would be the first confirmation that a potential short-term bottom has been made.
On the other hand, if there is no strength and the March low is violated, the odds would favor more near-term weakness and potentially a deeper correction over the next several weeks. On a side note, The NYSE Cumulative AD Line (chart not shown) is also trading under key support and slightly above its January low. Any further weakness in market breadth would not be positive.
Figure 6: Weekly Nasdaq Advance-Decline Line
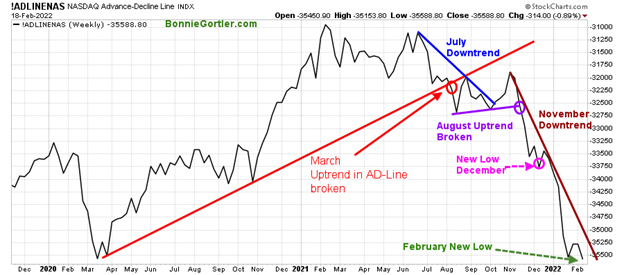
Source: Stockcharts.com
After breaking down in August last year, the Nasdaq Weekly AD-Line made a few attempts to form a bottom but failed. Nasdaq fell again, making a new low, spoiling the potential higher low of the weekly AD-Line, which implies that more time is needed for a bottom.
Until there is a rise breaking the November downtrend, the risk of selling is not yet complete, and further downside remains.
Figure 7: Daily iShares Russell 2000 (IWM) Price (Top) and 12-26-9 MACD (Middle) and Money Flow (Bottom)
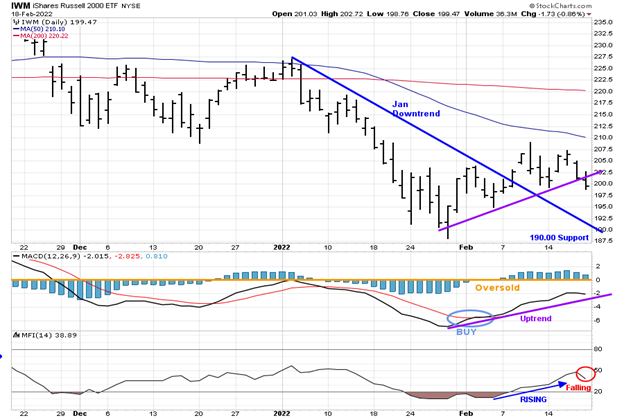
Source: Stockcharts.com
The top portion of the chart is the daily iShares Russell 2000 Index ETF (IWM), the benchmark for small-cap stocks, with a 50-Day Moving Average (MA) (blue line) and 200-Day Moving Average (MA), that traders watch and use to define trends. A false breakout occurred in November 2021 in IWM after being in a nine-month trading range.
IWM closed down -0.95% for the week remaining below its 50 and 200-Day Moving Average, with the short-term downside objective remaining at 178.00. The February uptrend and support at 200.00 was penetrated on Friday. Next, support 195.00 and 190.00. Resistance is 205.00 and 210.00.
MACD (middle chart) remains on a buy, failing to show much upside momentum, which is worrisome, failing to get above zero. It will be bearish confirming the uptrend broken in price in the short term if the February MACD uptrend (blue line) is broken. Money Flow (lower chart) rose since early February, but now Money Flow is falling, implying potential short-term weakness early into next week.
Figure 8: Daily Invesco QQQ Trust (QQQ) Price (Top), and 12-26-9 MACD (Bottom)
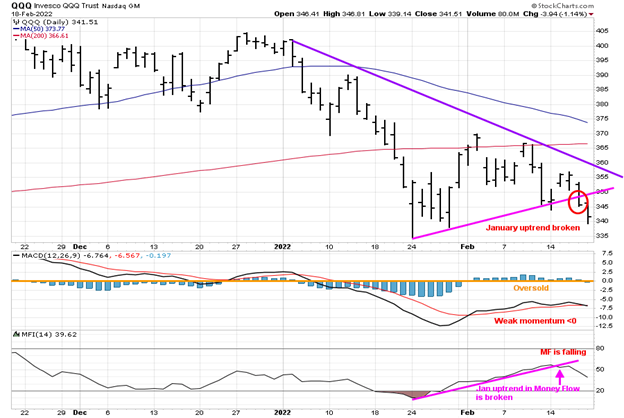
Source: Stockcharts.com
The chart shows the daily Invesco QQQ Trust (QQQ), an exchange-traded fund based on the Nasdaq 100 Index with its 50-Day Moving Average and 200-Day Moving Average. More weakness in QQQ last week closing down -1.60% at 341.51, QQQ closed below its 50 and 200-Day MA. The January short-term uptrend was broken. The downside objective remains at 330.00, followed by 310.00.
Resistance is at 350.00, followed by 360.00, and 370.00. A close above 360.00 would likely cause some short covering. Support is at 340.00 and 335.00. A close below 335.00 is likely to trip the sell stops and the decline to accelerate.
The lower chart is MACD (12, 26, 9), a measure of momentum. MACD is on a buy, falling below zero, and did not have enough upside momentum to reach zero, implying no underlying strength.
Money Flow is no longer rising and has broken the December uptrend, not a good sign and implies further downside. Until QQQ closes above 350.00 at a minimum, the short-term trend is down with the bears in control.
Intermediate-Term Trend Remains Down.
Figure 9: Weekly Invesco QQQ Trust (QQQ) Price (Top), and 12-26-9 MACD (Bottom)

Source: Stockcharts.com
The top chart shows the weekly Invesco QQQ Trust (QQQ) making higher highs peaking in November 2021 (red circles) but failed to make a new high in December and then turned down. The September 2020 uptrend broke down four weeks ago (middle purple line), giving a downside objective to 325.00 (lower channel).
MACD (lower chart) remains on a sell after making lower highs and breaking below support held since February 2020 (pink dotted line), implying weak underlying momentum. MACD has accelerated lower, now oversold, below zero, where buying opportunities develop once downside momentum subsides, price begins to rise, and a new uptrend starts.
Figure 10: Van Eck Semiconductors (SMH) Daily Price (Top), 12-26-9 MACD (Middle) and, Money Flow (Bottom)
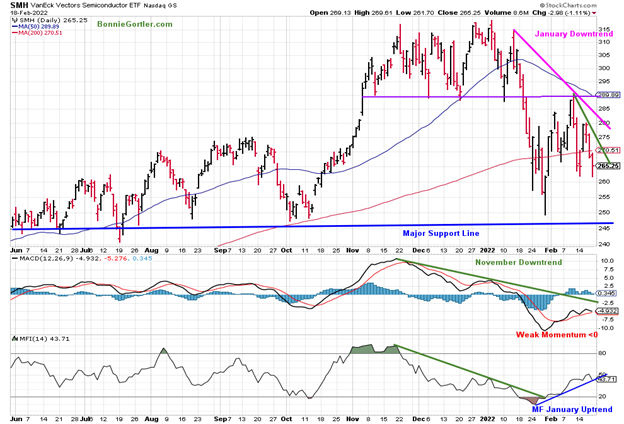
Source: Stockcharts.com
Van Eck Semiconductors (SMH) broke through resistance in October (green arrow) and surged higher until late November. SMH stalled, followed by a trading range. Support was broken in late January, and SMH fell sharply and has been highly volatile. There are two significant downtrends in effect: January (pink line) and February (green line). Resistance is at 275.00, followed by 290.00, and 310.00. Support is at 255.00 and 246.00.
MACD (middle chart) generated a buy (green circle) from an extremely oversold level implying the worst of the decline is over. However, with SMH below both the 50 and 200-Day MA, waiting for a confirmation of MACD to break the November downtrend and MACD rising above zero is less risk.
Money flow (lower chart) has already broken the November downtrend (green line), a positive sign in February more strength was possible. However, money flow has turned down and threatens to break the January uptrend. Expect volatility to increase and further downside pressure in SMH if this occurs.
Investors appear to be giving up on growth stocks.
Figure 11: ARKK Daily

Source: Stockcharts.com
ARK Innovations ETF (ARKK) is an actively managed ETF by Cathie Wood that seeks long-term growth and is highly volatile. ARKK broke its September short-term downtrend (brown line) in October 2021, followed by a failed rally peaking at 125.86 on 11/04/21.
Once ARKK fell below support at 94.00, it broke through the December uptrend (pink line) and accelerated lower. The downside momentum in ARKK picked up again as investors dumped growth stocks at any price, changing to risk-off mode. The January downtrend was broken (blue line) after ARKK stalled at resistance. ARKK turned lower, breaking the February uptrend intra-week (green line) closing below support at 70.00 mentioned in the Market Update 2/11/21, falling -9.87% closing at 64.80 for the week, shifting the short-term trend to down.
Resistance is at 75.00, followed by 77.50, and 90.00. Support is at 64.00, followed by 60.00. A close below 60.00 would imply further downside. MACD is on a buy but had weak momentum on the rise, failing to get above zero, implying internal weakness. Money flow (lower chart) is falling and threatening to break the January uptrend. ARKK remains high-risk volatile, with the bears winning the battle and in control for now.
Energy upside momentum is beginning to weaken.
Figure 11: United States Oil Fund (USO)

Source: Stockcharts.com
United States Oil Fund, LP (USO) is an exchange-traded fund (ETF) intended to track the price of West Texas Intermediate Light Sweet Crude Oil. Its benchmark is the WTI Crude Oil futures contract.
Barring a war with Russia that would change the fundamentals, the technical picture is weakening. The easy money is likely over. Oil may become rangebound in the short-term, starting a consolidation phase before extending the uptrend or a pullback begins.
Figure 11: United States Natural Gas (UNG)
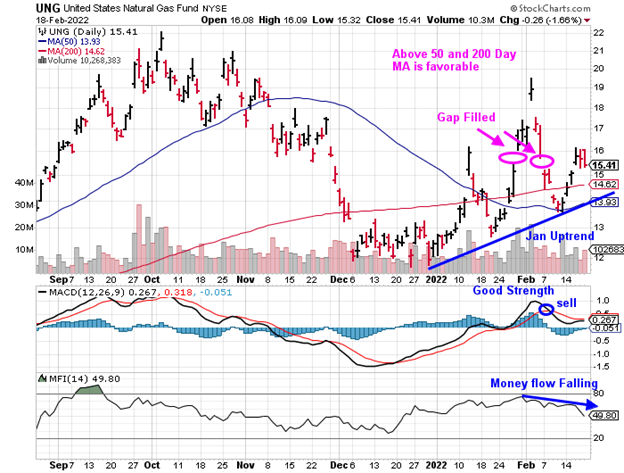
Source: Stockcharts.com
The United States Natural Gas Fund (UNG) is an exchange-traded fund (ETF) to follow the movement of natural gas prices that invests primarily in natural gas futures.
The uptrend from December remains in effect; however, like USO, momentum warnings are being given as demonstrated by MACD on a sell and Money Flow falling in jeopardy of being broken.
If you're in the Energy sector, be alert to a potential shift in the trend or at least a consolidation phase until it finds its direction. It may be an excellent time to reduce your investment holdings, protect profits, or place a tight stop to manage risk if there is a trend change.
Summing Up:
Uncertainty remains. Investors remain concerned about tensions between Ukraine and Russia, higher yields, and inflation. It's negative that momentum oscillators failed to generate any upside momentum despite being oversold. The bottoming process in equities continues in its fifth week since the January 16 lows. Investors are in a risk-off mode for now, but this could change quickly if the averages stabilize and turn up. Market sentiment is showing fear, suggesting the bottom is close at hand. For the tone to change and the downtrend to shift to an uptrend, be patient and not look to buy the bottom but watch for a sign of strength in Small Caps, Semiconductors, Technology, and improvement in market breadth on the NYSE and Nasdaq for the bulls to regain control.
Remember to manage your risk, and your wealth will grow.
I would love to hear from you. If you have any questions or comments or would like to talk about the market, email me at Bonnie@Bonniegortler.com
Disclaimer: Although the information is made with a sincere effort for accuracy, it is not guaranteed that the information provided is a statement of fact. Nor can we guarantee the results of following any of the recommendations made herein. Readers are encouraged to meet with their own advisors to consider the suitability of investments for their own particular situations and for determination of their own risk levels. Past performance does not guarantee any future results.


