

What if the Ukraine market meltdown was the bottom in stocks? The fact is that given the amount of short covering that we saw in the last few days, and the huge explosion in bearish sentiment, nothing would surprise me, states Joe Duarte, technical specialist and editor of In the Money Options.
I am certainly not triple-mortgaging my house to buy stocks on margin. But I am sprucing up my buy list and reloading my hedges at the same time—just in case.
Chaos, by definition, is predictably unpredictable. Which is why it was no surprise that stocks bounced back in a big way on 2/25/22 after the bear market signals were tripped on the prior day based on news of Russia’s invasion of Ukraine. That’s because algos are betting that the Fed will back down from their promise to raise interest rates as the situation in Ukraine unfolds.
Of course, there are no guarantees that any such thing will happen. Thus, stocks could break to new lows just as easily as they could make a huge move up over the next few days. But that’s the bet at the moment. And they may be right. Thus as traders, we must be ready to adjust. All of which makes it worthwhile to explore the stakes for investors as this completely unpredictable situation develops.
Meanwhile, as I discuss in detail below, the New York Stock Exchange Advance Decline line (NYAD) may have delivered a bullish technical divergence. So, what’s the bottom line? If that was the bottom, it may be time to buy once again. We should know more in the next few days for sure.
Getting Up to Speed
A recap of what the Fed seems to be trying to do is in order.
The short version is that the gang at the Eckles Building is has been talking stock prices down before they raise interest rates so that they have to deliver fewer rate hikes. In other words, the Fed doesn’t want a deep recession—more like a time-out in the economy.
Their concern, and it is valid, is that since the stock market is the lifeline for those people who spend money and keep the economy afloat (the MELA system), a deep flesh wound to the pocketbook will suffice.
For those unfamiliar with the MELA acronym, M is for markets, E is for Economy, L is for life decisions, and A is for algos. When the stock market is rising the economy tends to rise as people make decisions to spend money. The algos, the artificial intelligence that is everywhere just accentuate the trend.
Unfortunately, MELA’s spending habits are so tied to the stock market, that even a modest pullback can trigger a larger than hoped for slowing for the economy as this subset of the population, which depends on the status of their 401 (k) plans, their IRAs, and their trading accounts (Bitcoin included) is quick to adjust.
That’s because the MELA crowd is well plugged into the markets but is also in debt. Still as long as the market’s rising, debt is just a part of the financial plan. Unfortunately, if the Fed crashes the market, incomes drop, debt becomes harder to service and other areas of spending will suffer—mortgages, car payments, going out to dinner, weekend shopping sprees, Netflix memberships.
The EBITDA World and the Connection to MELA
The truth is that the MELA phenomenon is a mirror image of the corporate EBITDA (earnings before interest, taxes, depreciation, and amortization) model. That’s the term used by corporations to show investors how much money they would make if they didn’t have expenses.
EBITDA companies, usually growth companies, do well if they can increase their revenues and pay their debt. But even the most able management team must make the transition from EBITDA (pretend profits) to real profits. The best modern example of how this works is to study the rise of Amazon.com (AMZN), which in its early days was the ultimate EBITDA company, and how it transitioned to the profitable behemoth it finally became.
The problem with EBITDA is that when revenues fall, the debt is still there. Thus, the company has to redeploy its falling revenues into paying debt. This takes money away from research, development, capital expenses, and keeping and recruiting employees. No doubt, EBITDA works on Wall Street, since companies can just sell more bonds or tap their nearly infinite lines of credit. This can work for a lot longer than anyone expects. Think about emerging biotech stocks.
But in the MELA world, where people live, when the stock market falls, credit card and mortgage payments don’t go away. And lines of credit, if any are actually available, are finite. As a result, in the MELA universe, reduced revenues from lower stock prices have to be redeployed and someone or some part of the spending plan takes the hit.
Concern from this group is evident in the latest consumer confidence survey from the University of Michigan.
So now you can see why the Fed is now in a heap of trouble, and why the algos are betting that Ukraine will give the central bank pause on its quest for higher rates.
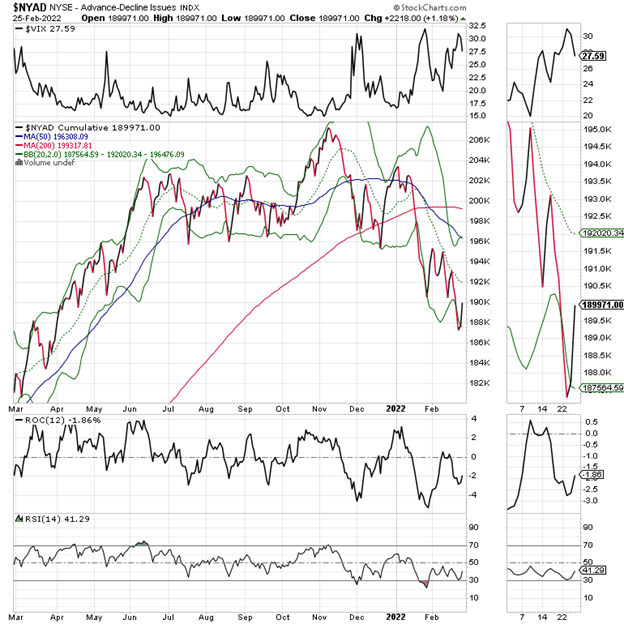
Market Breadth Rebounds from Near Death Experience with Bullish Divergence Appearing
The New York Stock Exchange Advance Decline line (NYAD) finally turned around after a dismal couple of weeks. Of course, it’s hard to know whether this is the ultimate bottom or not.
There is, however, the possibility of a bullish divergence, as NYAD made a new low, but the RSI did not make a lower low compared to its most recent low. This suggests that we may see the panic bottom and that prices may stabilize now.
But one thing is for sure. NYAD is very oversold, which when combined with the reversal in the CBOE SPX Volatility Index (VIX), which measures put option volume, there may be some hope.
A rise in CBOE SPX Volatility Index (VIX) signals that put option volume (bets that the market is going to fall) are on the rise. What follows when put volume rises is that rising put volumes cause market makers to sell puts and simultaneously hedge their bets by selling stocks and stock index futures.
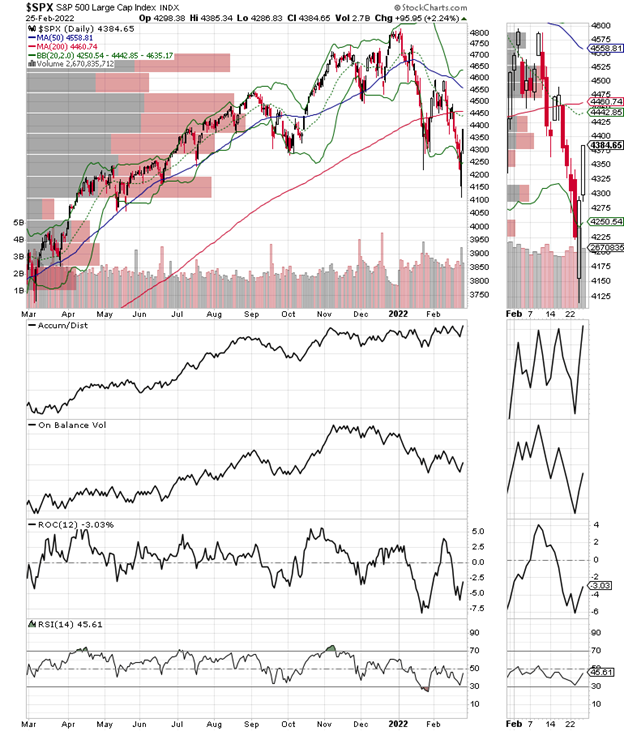
The S & P 500 (SPX) remains below its 200-day moving average, but it’s back inside the Bollinger Bands, which means that there is now a chance that a reversion to the mean, a test of the 200-day line is in the offing. On Balance Volume (OBV) is still a bit soft, but Accumulation Distribution (ADI) suggests that the rally is short covering at the moment. The index did move back to the trading range between 4300 and 4650 after a decisive move below 4300, as I noted could happen, led to lower prices in a hurry. Still, just as with NYAD, we see that lower low in prices and that higher low on RSI.
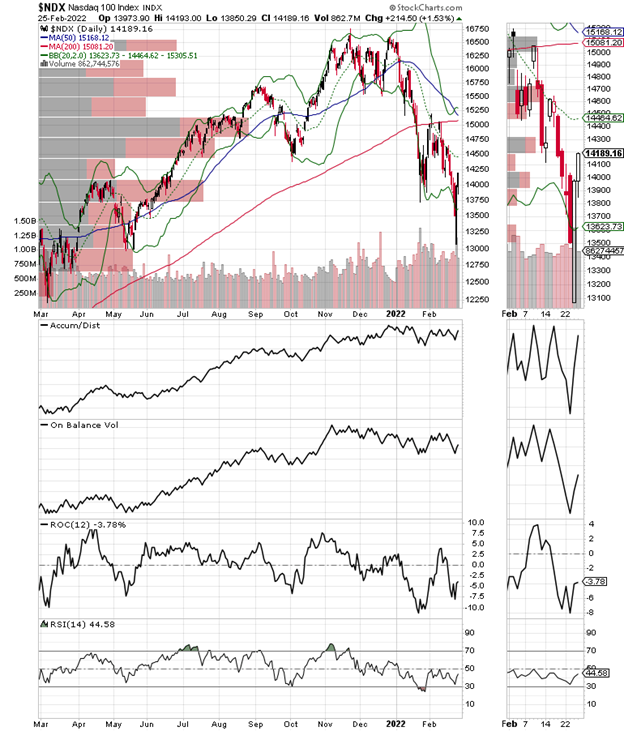
The Nasdaq 100 index (NDX) remained below its 200-day moving average, but is also showing a bullish divergence with a new price low and a higher low on RSI.
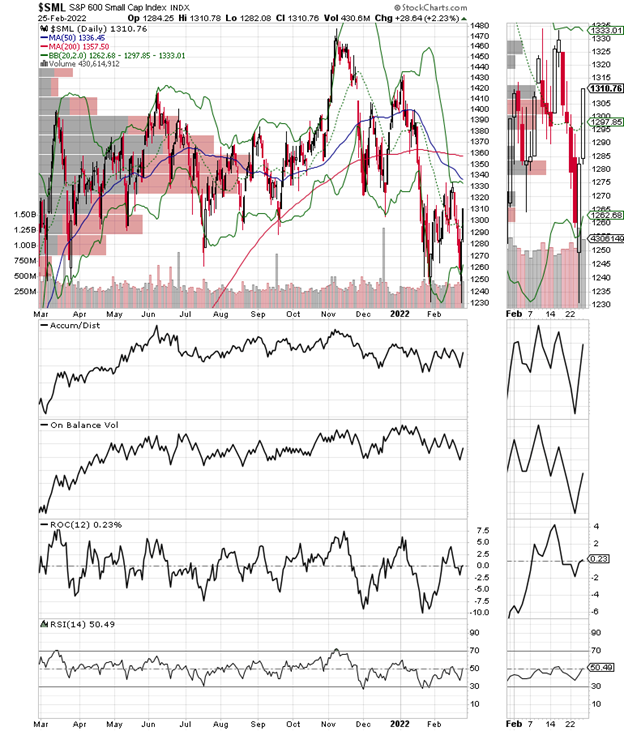
The S&P Small Cap 600 index (SML) is exhibiting a similar potentially bullish technical divergence.
To learn more about Joe Duarte, please visit JoeDuarteintheMoneyOptions.com.


