

One reason I decided to start this series in the first place was to clear up a lot of the misconceptions about technical analysis and behavioral finance, states JC Parets of AllStarCharts.com.
Before getting into more detail, I think it is important to define what technical analysis even is and explain what some of the differences are between technical and fundamental analysis in the market. Throughout this platform I use the word “Market” interchangeably to describe all liquid capital markets including the Stock Market, Interest Rates, Commodities, and Currency Markets. The principles discussed here can be seen across each of these asset classes on both short-term and longer-term time horizons.
In 1948, Robert D. Edwards and John Magee wrote what today is considered “The Bible of Technical Analysis”. Technical Analysis of Stock Trends is the most influential book written about the process of interpreting the predictable nature of markets and the investing community. In this book, Edwards and Magee defined Technical Analysis as, “The Study of the Action of the Market Itself, as Opposed To the Study of the Goods in which the market deals”. A lot of what Edwards and Magee wrote about in 1948 derived from the writings of Charles Dow over 60 years prior to their publishing.
Charles Henry Dow, who is widely considered to be the Father of Technical Analysis, was the co-founder of Dow Jones & Company along with a gentleman by the name of Edward Jones. Although he was born and raised in Connecticut, Charlie got a job as a newspaper reporter in Springfield, MA when he was 21 years old. He wanted to write about companies, so he would visit them to ask questions. Since there was no Securities & Exchange Commission at the time (the SEC was created in the 1930s), companies were not forced into answering the questions. “My business is none of your business”, they would tell him. But Charlie was aware enough to see big money moving in and out of stocks.
Charlie realized that the majority of the securities of established companies tended to go up or down in price all together. Stocks that went in the direction against the financial tide were few and far between. It was rare for a stock to move countertrend to the overall market for more than a few days. If markets were going up, a large majority of the securities would rise, and if markets were falling, stocks would generally fall together. Although there were some instances where some stocks would rise faster than others in good times, and some would fall more rapidly than others during bad times, the point was that the direction of these trends coincided with the direction of the entire group. This was the case then and still is the case today.
Charlie recognized that there were two groups of companies that ran the economy. You had the companies that made the products, the producers, and you had the companies that hauled those products, the railroads (remember this was just after the civil war, so it was just the railroads that moved products. Today we have other methods of delivery). In the 1880s, Charlie decided to create two averages: The Dow Jones Industrial Average and the Dow Jones Railroad Average. The original Industrial Average included just 12 issues, which was later increased to 20 in 1916, and eventually to 30 in 1928 (although the components have changed since then, the number of issues has remained the same). The other was the Railroad Average, which consisted of 20 Railroad companies and were some of the most dominant companies of their day.
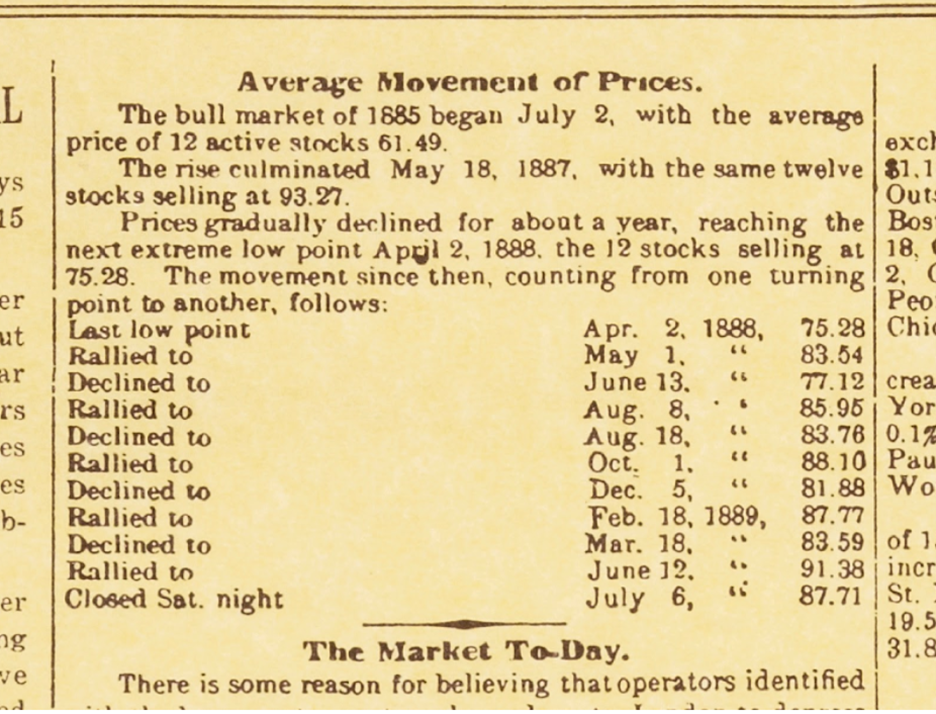
Here is a photo of the first edition of the Wall Street Journal in 1889 where Charles Dow started recording prices changes in a column titled “Average Movements of Prices”:
Since the mid- to late-90s, technical analysis has gone from hand drawn charts to more sophisticated, computer-based charting software. I’m lucky to start my career after computers had already taken the role of plotting price and price derivatives like momentum oscillators and smoothing mechanisms. But prior to computers, these charts were created by hand with price data that was calculated daily.
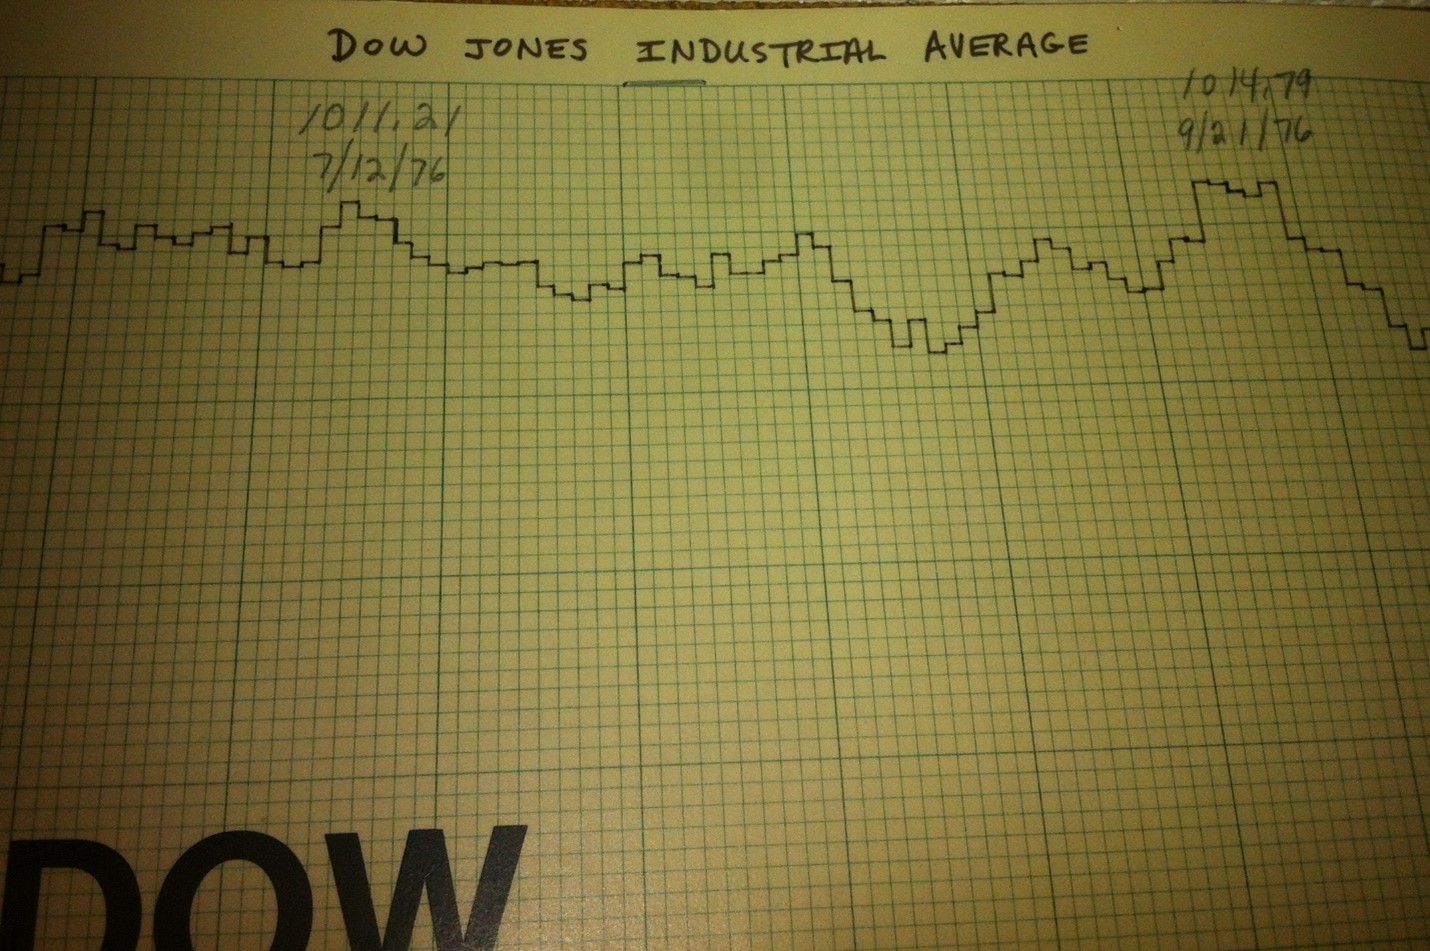
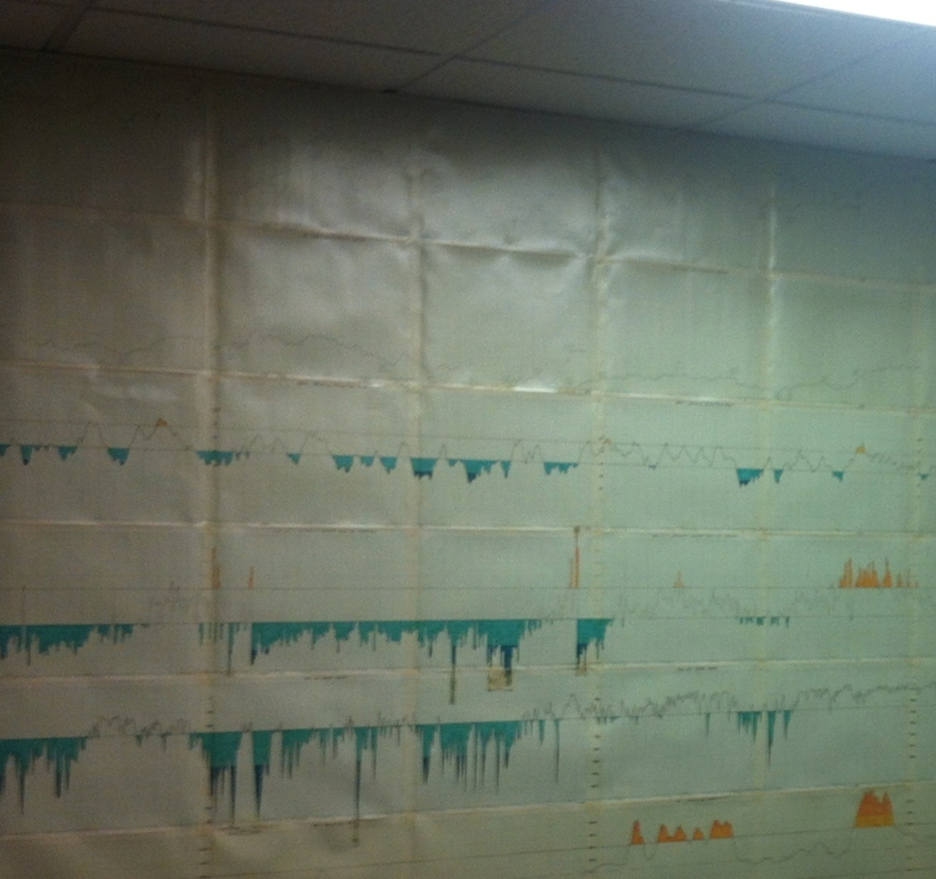
Here are legendary Technician Ralph Acampora’s hand drawn charts from the 1970s that I found one day visiting some friends at the old Market Technicians Association headquarters on Broadway in New York City:
Technicians are often associated with charts or chart analysis. But it’s not so much that the charts tell you what to buy and sell, it’s just that technical analysis studies the changes in equilibrium between supply and demand. So, it just so happens that the best way to visualize these changes in equilibrium is in chart form. This is why you’ll see many charts throughout this research platform.
Some of the smartest people in the past few hundred years have attempted to master the market and have failed miserably. The profits that one can achieve from successful market participation are enormous. So it should be no surprise that world renowned analysts and even Nobel Prize Winners have tried and failed at market speculation. Granted, there have been many success stories along the way, but they are the exception not the rule. They put in their 10,000 hours, as Malcolm Gladwell so eloquently put it in his book, Outliers.
To really get a good understanding of the principles behind technical analysis, I think it’s important to be clear about the philosophy and psychology behind the supply and demand dynamics that make technical analysis possible in the first place.
Markets Trend
An important concept that needs recognition is that markets trend. There is a much higher likelihood for a market trend to continue than there is for it to reverse course. If a market is trending higher, there is a much greater chance that it continues to rise, than for it to start a new downtrend. Same thing in a downtrend. If prices are falling, there is a higher chance that they keep falling, or keep underperforming, than for it to reverse and start a new bull trend.
Throughout this research platform we’ll use various tools that we have at our disposal to help us recognize that a trend may be changing. These range from momentum tools, to sentiment, to simple pattern recognition. But changes in trend are often a process. Remember that prices are driven by large institutional fund managers that move billions and billions of dollars each day. Changes in trend are therefore more of a process, not an event. Think of it like a cruise ship. These massive vessels can’t just reverse course at the press of a button. It takes time and there are certain characteristics that can be recognized as the turning is taking place. The market behaves in a similar fashion.
These changes in trends are reflections in the changes in supply and demand dynamics, which is driven by human nature. The terms Fear and Greed are two extremes in human psychology that help drive these changes in equilibrium between supply and demand. Regardless of whether these are humans entering buy and sell orders, or algorithms built by humans to buy and sell, these actions still reflect the fear and greed mentality that is inside the human brain. Therefore, for hundreds of years this behavior can be visualized through patterns in price charts that are repeated over and over again. Markets might change over the years in terms of how we execute, or perhaps the economic or political environment during different years, but at the end of the day, humans are still the same and human emotions are what drives price.
This is why the behavior of the market does not change.
This is also why patterns in price we see today can be identified in price charts 100 years ago. I’m willing to bet these same patterns will be seen in price charts 100 years from now.
Learn more about JC Parets at AllStarCharts.com.


