

The major averages, growth stocks, and global markets continue lower while commodities soared. Five SPDR S&P 500 sectors rose with the S&P ETF (SPY) down –1.27%. Energy (XLE) and Utilities (XLU) were the strongest sectors, while Technology (XLK) and Financials (XLF) were the weakest, states Bonnie Gortler of bonniegortler.com.
2/25/22 - 3/4/22
S&P SPDR Sector ETFs Performance Summary
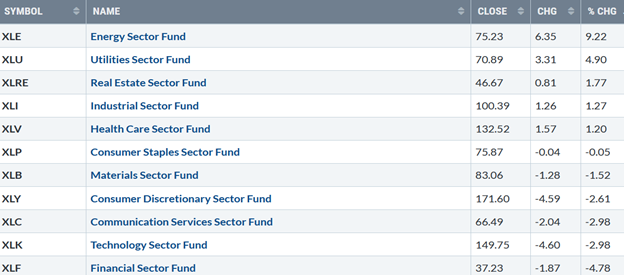
Source: Stockcharts.com
Figure 2: Bonnie's Mix of ETFs To Monitor
Performance Summary 2/25/22 - 3/04/22
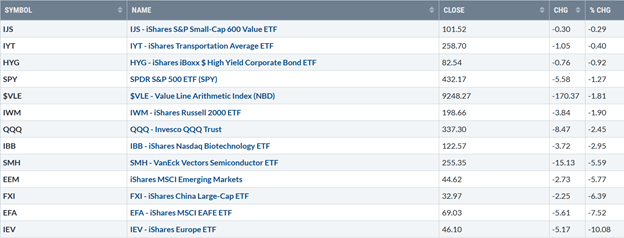
Source: Stockcharts.com
The war on Ukraine intensified. US and global markets sold off sharply, especially in Europe. Semiconductors, Small Caps, and Technology stocks continued to trend lower. Fear increased among investors as emotions took over, showing signs of panic dumping overvalued companies and quality stocks. As a result, the 10-Year US Treasury yields fell sharply last week, closing at 1.724%.
Figure 3: UST 10-Year Bond (TNX) Yields Daily
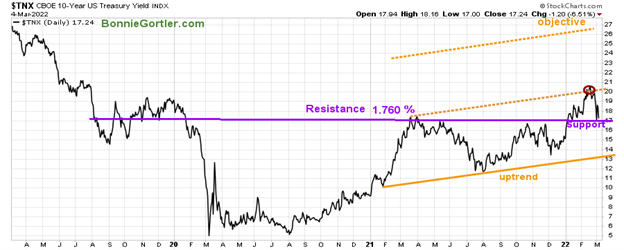
Source: Stockcharts.com
Figure 4: UST 5YR Bond (FVX) Yields Daily
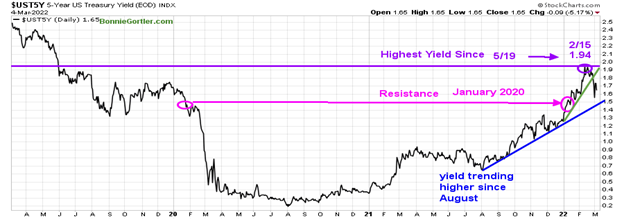
Source: Stockcharts.com
5-Year US Treasury yields also fell sharply, closing at 1.65%, breaking below the 2022 uptrend (green line). Support is 1.5% .
The Dow (DIJ) closed lower for its fourth straight week -1.30%. S&P 500 (SPX) fell -1.27%, while Nasdaq (IXIC) dropped -2.78%. The Russell 2000 Index (RUT) fell -1.96 %, and the Value Line Arithmetic Index (a mix of approximately 1700 stocks fell -1.81 %.
Weekly market breadth remains negative. The New York Stock Exchange Index (NYSE) had 1600 advances and 1963 declines. The Nasdaq had 1751 advances and 1822 declines. There were 230 new highs and 450 new lows on the NYSE and 194 new highs, and 925 new lows on the Nasdaq.
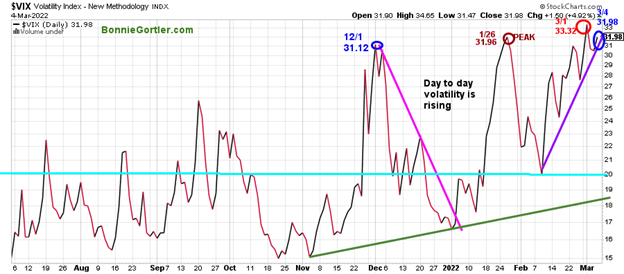
Figure 5: CBOE Volatility Index (VIX)
Source: Stockcharts.com
The CBOE Volatility Index ($VIX), a measure of fear, remains above average in 2022. VIX previously peaked at 31.96 on 1/26 (brown circle) but made a new closing high on 3/1 of 33.32 (red circle) before contracting slightly to close on 3/4 at 31.98 (blue circle). Day-to-day volatility as measured by CBOE Volatility Index (VIX) is high. Expect the wide intraday swings to continue until there is a close below 24.00.
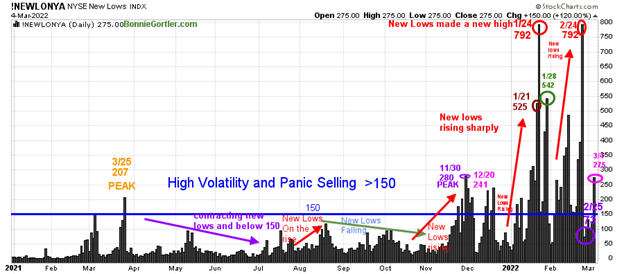
Figure 6: Daily New York Stock Exchange (NYSE) New Lows
Source: Stockcharts.com
Watching new lows on the New York Stock Exchange is a simple technical tool that helps awareness about the immediate trend's direction.
New lows warned of a potential sharp pullback, high volatility, and "panic selling" for most of 2022, closing above 150. Learn more about the significance of new lows in my book, Journey to Wealth, published on Amazon. Here is an excerpt, “When new lows are above 150, the market is negative, higher risk, selling is taking place. Sometimes it could be severe, and sometimes on a very nasty day, you can have 'panic selling,' and big wild swings (high volatility) to the downside may occur.”
As the market sold off in January, new lows rose sharply, peaking at 792 (red circle) on 1/24. New lows narrowed to 542 (green circle) on 1/28 and began contracting but not enough to be in a safe, low-risk zone.
On 2/24, new lows jumped to 792, matching the 1/24 peak, but quickly contracted on 2/25, closing at 73 (purple circle), the lowest reading since 2/2 dropping below 150, giving a hopeful sign the worst is over. However, after a few days of new lows contracting to below 150, they did not get to the lower risk zone between 25 and 50 and finished the week at 275 (pink circle) and rising.
It would be positive for the short-term if new lows contracts below 150 for at least two days and then ultimately falls to between 25 and 50, indicating lower risk. On the other hand, if they remain above 150, continued selling pressure is likely.
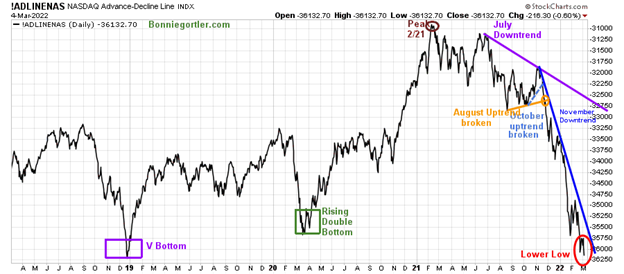
Figure 7: Daily Nasdaq Advance-Decline Line
Source: Stockcharts.com
Market breadth on the Nasdaq remains in a downtrend in 2022. The daily Nasdaq AD-Line peaked in February 2021 (brown circle), followed by failed attempts to make a new high. After breaking the October uptrend (blue dotted line), the AD-Line made a series of lower highs and lower lows in November, December, and January. Two clear-down trends (blue and purple) remain in effect.
A double bottom pattern potentially making a higher low similar to March 2020 (green rectangle) and the potential V bottom identical to December 2019 (purple rectangle) was developing. However, there was insufficient strength last week, and the AD-Line again made a lower low.
It will be positive in the short term if there are more advances than declines this week where AD-line turns up breaking the November downtrend (blue line).
For now, last week's rally failed, and there was more near-term weakness in market breadth, meaning a deeper correction could occur over the next several weeks if market breadth doesn't improve immediately.
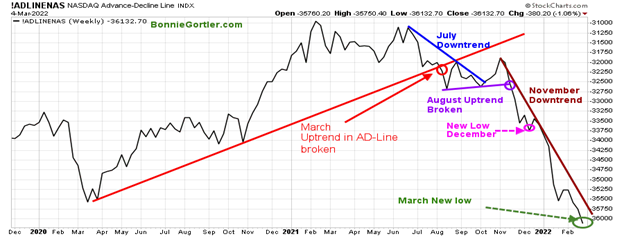
Figure 8: Weekly Nasdaq Advance-Decline Line
Source: Stockcharts.com
After breaking down in August last year, the Nasdaq Weekly AD-Line made a few attempts to form a bottom but failed, continuing to make lower lows In January February, continuing in March. Attempted rallies could not break the November downtrend, and selling continued.
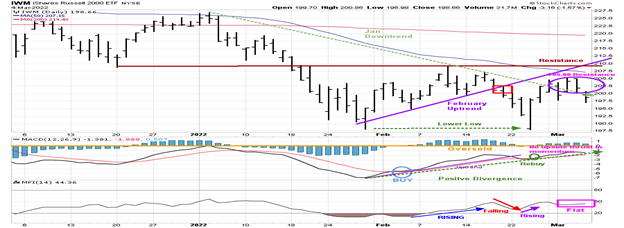
Figure 9: Daily iShares Russell 2000 (IWM) Price (Top) and 12-26-9 MACD (Middle) and Money Flow (Bottom)
Source: Stockcharts.com
The top portion of the chart is the daily iShares Russell 2000 Index ETF (IWM), the benchmark for small-cap stocks, with a 50-Day Moving Average (MA) (blue line) and 200-Day Moving Average (MA), that traders watch and use to define trends. A false breakout occurred in November 2021 in IWM after being in a nine-month trading range.
The February uptrend and support at 200.00 was penetrated on 2/18 (red rectangle) and remained below its 50 and 200-Day Moving Average.
IWM fell -1.90% for the week, closing at 198.66. After closing near the previous week's highs, IWM failed to close over resistance at 205.00 and turned lower, which appears to be a false breakout of the January downtrend (green dotted line).
Short-term resistance remains at 205.00, 207.50, and 210.00. However, a close above 210.00 could begin a potential big move to the upside. On the other hand, if IWM closes below 197.00 for two days, IWM could test the February low and fall quickly to 187.00, possibly to the short-term downside objective at 178.00 if it doesn't hold.
MACD (middle chart) has not shown much upside momentum in 2022, failing to get above zero. The MACD has a bullish positive divergence and a rebuy. IWM made a lower low, with MACD making a higher low. However, unless there is an immediate turn-up, MACD is now threatening to take out the uptrend that has formed since the end of January (green dotted line), which is concerning. Money Flow (lower chart) has been changing direction quickly since February. Now it's flat.
In Sum:
Downside momentum slowed, and a positive divergence has formed. However, IWM has not shown any follow-through to the upside, momentum remains weak, and money flow is flat, which is worrisome.
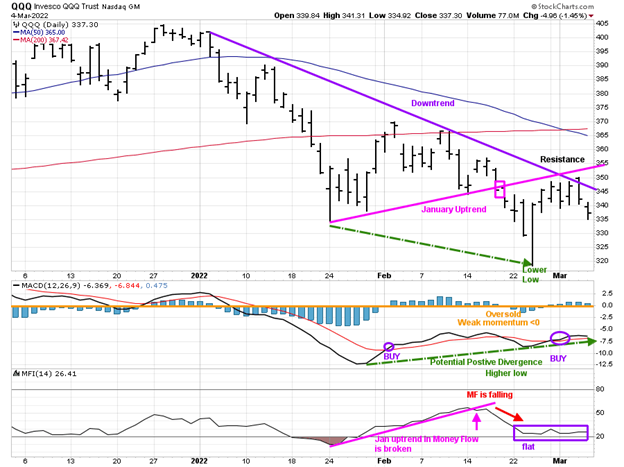
Figure 10: Daily Invesco QQQ Trust (QQQ) Price (Top), and 12-26-9 MACD (Bottom)
Source: Stockcharts.com
The chart shows the daily Invesco QQQ, an exchange-traded fund based on the Nasdaq 100 Index with its 50-Day Moving Average and 200-Day Moving Average. QQQ accelerated after breaking the January uptrend (pink rectangle), penetrating the January lows and falling through the first downside objective at 330.00, not reaching the lower objective of 310.00 before reversing higher.
QQQ stalled at 351.00 resistance and turned lower last week, closing at 337.30 down -2.45% remaining below its 50 and 200-Day MA. Resistance remains at 351.00, followed by 355.00, and 370.00. A close above 351.00 would be positive and likely cause short covering.
Support is at 335.00, 327.00, and 320.00. A close below 335.00 is likely to imply another test of the February low. The lower chart is MACD (12, 26, 9), a measure of momentum. MACD is on a buy, falling below zero but not enough upside momentum to reach zero, not a good sign. A positive divergence has formed, and a repeat buy in MACD, but no rise is concerning.
Money Flow is no longer falling and has flattened after breaking the December uptrend.
Until QQQ closes above 351.00 and MACD and Money Flow start to rise, the risk of a test of the February lows remains. Intermediate-Term Trend Remains Down: Downside QQQ objective hit on 2/22.
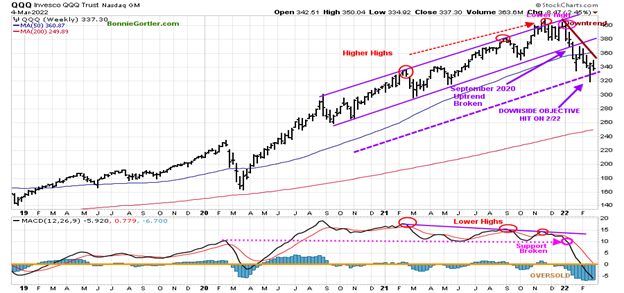
Figure 11: Weekly Invesco QQQ Trust (QQQ) Price (Top), and 12-26-9 MACD (Bottom)
Source: Stockcharts.com
The top chart shows the weekly Invesco QQQ Trust (QQQ) making higher highs peaking in November 2021 (red circles) but failed to make a new high in December and then turned down. The September 2020 uptrend broke down six weeks ago (middle purple line), giving a downside objective to 325.00 (lower channel), which hit on 2/22; a meager rally attempt occurred after.
MACD (lower chart) remains on a sell after making lower highs and breaking below support held since February 2020 (pink dotted line), implying weak underlying momentum.
MACD remains oversold, below zero, now lower than the March 2020 low. Be alert for downside momentum to subside, and MACD begins to flatten and turn up for a safer entry.
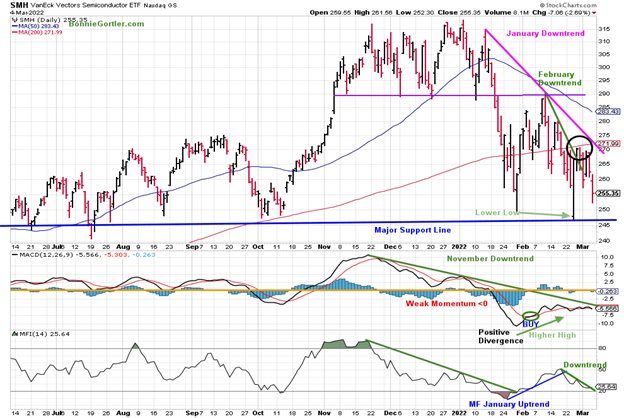
Figure 12: Van Eck Semiconductors (SMH) Daily Price (Top), 12-26-9 MACD (Middle) and, Money Flow (Bottom)
Source: Stockcharts.com
Support was broken in late January, and SMH fell sharply. SMH briefly penetrated the February downtrend (green line) but did not generate any upside strength (black circle) to break the January downtrend (pink line).
SMH fell sharply last week, closing at 255.35 down -5.59%. Support is at 246.00, and resistance is at 270.00, followed by 280.00, and 290.00.
MACD (middle chart) generated a buy (green circle) in February from a deeply oversold level. SMH rallied, but MACD did not get above zero. In late February, a positive divergence formed, which made me optimistic a short-term rally was likely. However, the rally was short-lived. SMH has not gained enough momentum to break the November downtrend (green line), confirming the latest reentry, which is concerning.
Money Flow (lower chart) had a few turn-ups but also is in a downtrend (green line).
For a potential sustainable rally in the future, the MACD January downtrend first needs to be broken, and SMH stays above 246.00.
Figure 13: Daily ARK Innovation (ARKK)
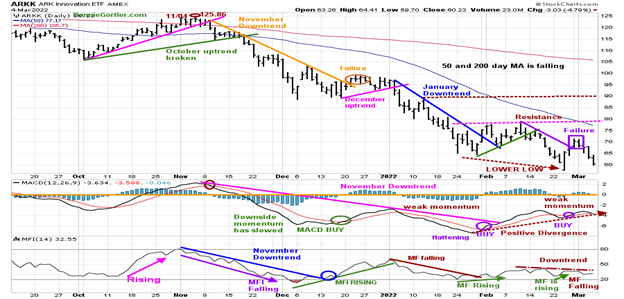
Source: Stockcharts.com
ARK Innovation (ARKK) is an actively managed ETF by Cathie Wood that seeks long-term growth and is highly volatile. ARKK broke its September short-term downtrend (brown line) in October 2021, followed by a failed rally peaking at 125.86 on 11/04/21. Once ARKK fell below support at 94.00, it broke through the December uptrend (pink line) and accelerated lower.
Downside momentum temporarily subsided where ARKK broke its February downtrend (purple line) but failed to close above resistance (pink dotted line) and reversed lower, closing near the low for the week at 60.23, down -11.19%.
Resistance is at 72.50, followed by 77.50, and 90.00. Support is at 57.00.
MACD failed to get above zero since November 2021, implying internal weakness. However, MACD's recent repeat buy signal and positive divergence, which is normally a bullish pattern, is not materializing yet.
Money flow (lower chart) is in a downtrend. I would like to see Money flow rise above the February high reading (brown dotted line) for a sign that investors are stepping in to buy.
ARKK remains high-risk and volatile, with the bulls failing to reestablish control; a close below 57.00 would imply further downside.
Oversold presents an opportunity but is not a buy signal in itself. Momentums patterns are oversold, but the downtrend prevails until proven otherwise. The bears remain in control, continuing to sell all rallies.
Summing Up:
The bulls failed to reestablish control last week as the war on Ukraine intensified. Oil prices surged to their highest since 2011. Commodities prices soared. The short and intermediate trends in the major averages remain down. Each rally attempt only lasts a few days, with no follow-through despite oversold momentum oscillators with and in areas where buying opportunities in the past typically develop. Until there is some potentially positive news between Ukraine and Russia, downtrends broken to the upside, an improvement in market breadth, stocks are likely to be under pressure, and day-to-day volatility to be high.
Remember to manage your risk, and your wealth will grow.
I would love to hear from you. If you have any questions or comments or would like to talk about the market, email me at Bonnie@Bonniegortler.com
Disclaimer: Although the information is made with a sincere effort for accuracy, it is not guaranteed that the information provided is a statement of fact. Nor can we guarantee the results of following any of the recommendations made herein. Readers are encouraged to meet with their own advisors to consider the suitability of investments for their own particular situations and for determination of their own risk levels. Past performance does not guarantee any future results.


