

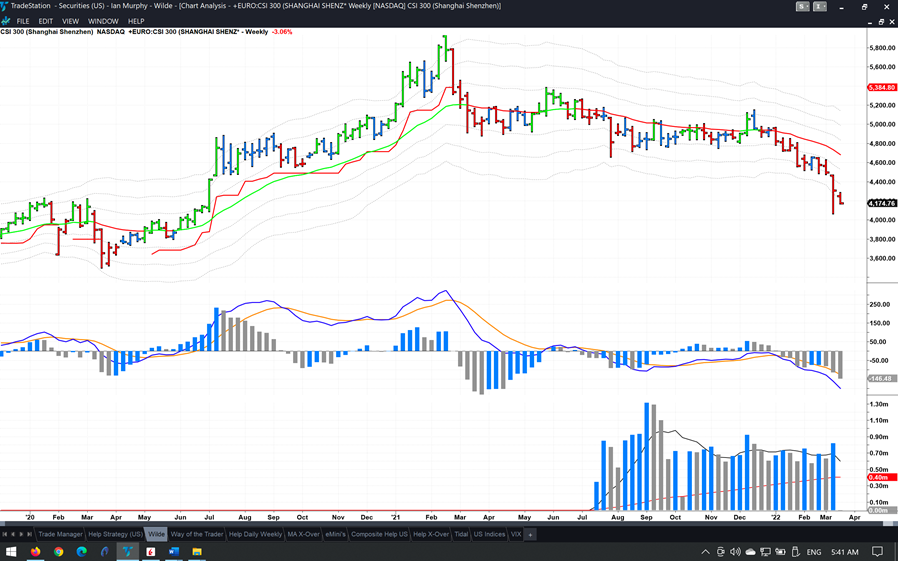
Friday’s note drew attention to the selloff in Chinese equities, states Ian Murphy of MurphyTrading.com.
Bearish sentiment continued overnight with the CSI300 closing 3.06% lower as authorities locked down the city of Shenzhen, an important tech hub.
Click charts to enlarge
It is rare for a broad stock market index to stay below its -3ATR channel on a weekly chart for a prolonged period, and a relief rally back to the EMA usually follows when the weak hands have been washed out, but it doesn’t look like we are there yet.
Click charts to enlarge
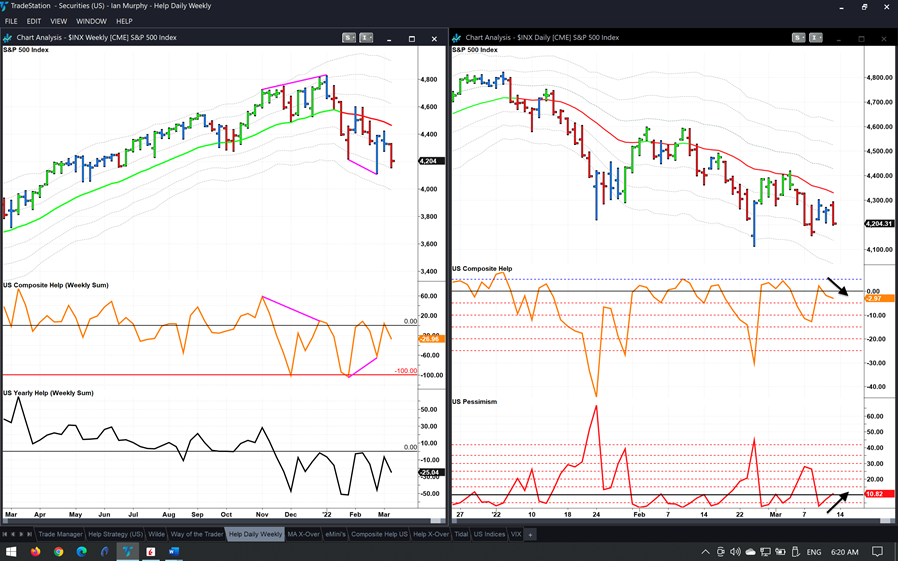
US equity markets reversed on Friday with the S&P500 (SPX) closing below the -1ATR on a daily chart accompanied by the price bar reverting to red, meaning the EMA and MACD-H both ticked down (right above). On the weekly chart (left), the price bar is also red and continues to trade below the -1ATR line on this longer time frame.
The Pessimism Indicator, which counts the number of stocks making new 20-day lows, ticked up and closed above 10%, the threshold level above which a bullish move is unlikely. Composite Help is back below zero, and stocks do not go up when this leading market indicator is going down.
Learn more about Ian Murphy at MurphyTrading.com.


