

Wall Street is concerned about the impact of the Fed’s planned tapering, states George Dagnino, chairman of Peter Dag Strategic Money Management.
However, rising inflation and labor costs will hinder economic growth. Slower consumers’ spending and cutting costs by business will slow down the growth of the money supply M2.
The historical growth of the money supply M2 is closely related to the average growth of the economy before inflation.
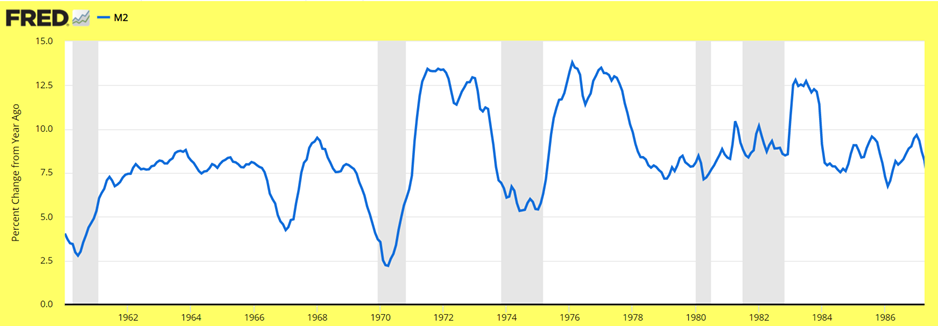
Source: St. Louis Fed
The historical average growth rate of the money supply M2 is about 6%. This growth is needed to have an economy growing approximately at a 3% pace with 3% inflation. This growth is also close to the average appreciation of the stock market before dividends over the long term.
The above graph shows the growth of M2 in the 1960s was about 6%. In the 1970s the growth of M2 doubled, soaring to 13%. This growth was needed to finance massive government budget deficits required to fund a war and rising social welfare programs (see above chart). The outcome was steadily rising inflation. In 1980, inflation hit 15%.
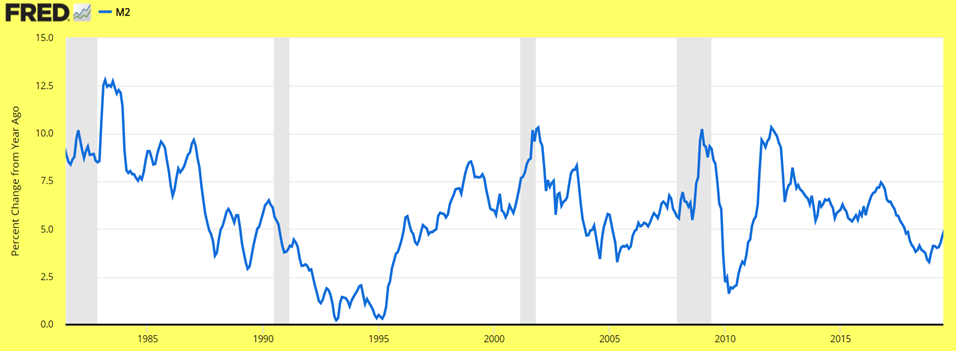
Source: St. Louis Fed
Beginning in early 1980, the growth of M2 started to decline to an average growth rate of about 5%-6% (see above chart).
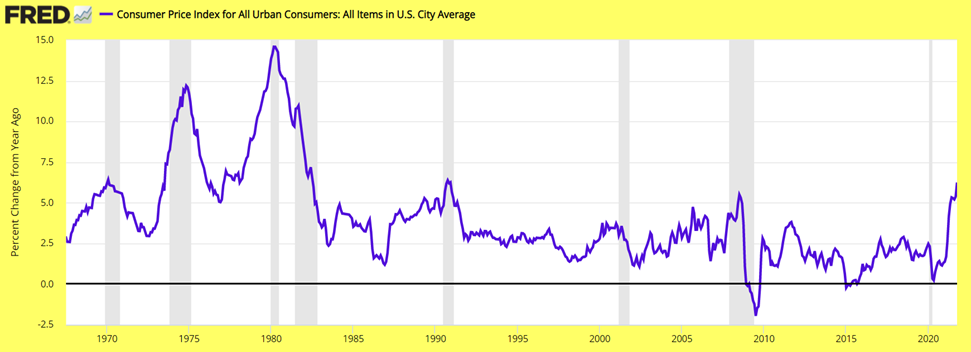
Source: St. Louis Fed
As the growth of M2 declined close to its historical average, inflation also headed lower. Until 2019, the growth of consumer prices over 12 months has been about 2%-3% (see above chart), reflecting a much slower growth of M2.
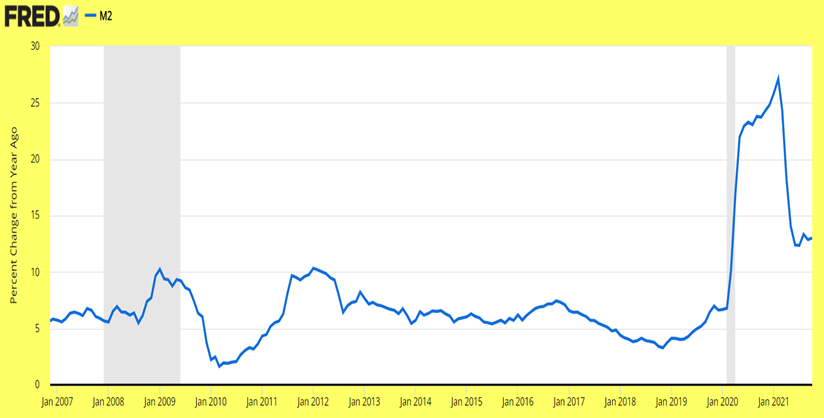
Source: St. Louis Fed
Beginning in 2020, because of the government’s many social programs to protect the economy from Covid-19, the growth of the money supply M2 was allowed to expand at the torrid pace of more than 25% over 12 months (see above chart).
Source: St. Louis Fed
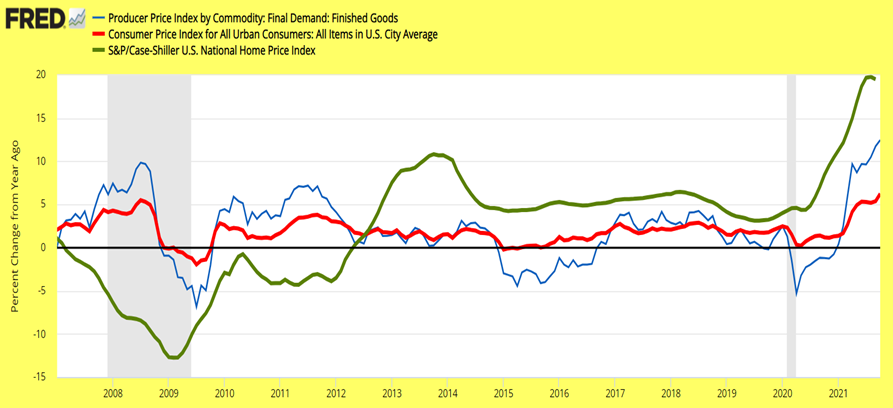
In 2020 the strong growth of M2 was followed, as it did in the 1970s, by rising inflation. Home prices soared from below 5% y/y to above 20% y/y. Producer prices jumped from close to 0% y/y to more than 12% y/y. Consumer prices rose from 1.7% y/y to 6.2% (see above chart).
Source: St. Louis Fed
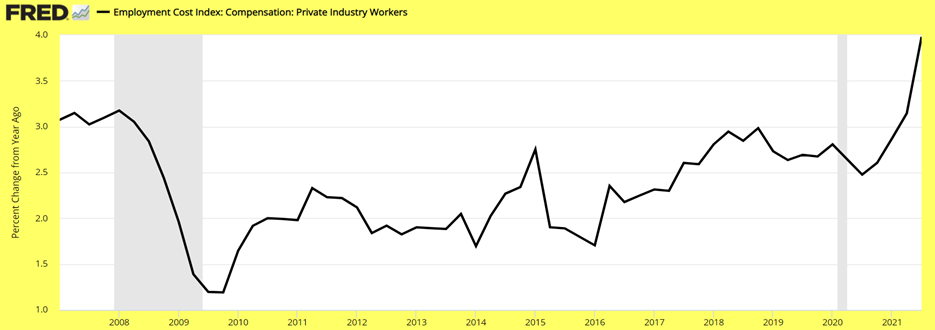
Inflation did not only show at the consumer level. Inflation is transmitted to business through rising input costs. It is no coincidence as inflation at the consumer level rose sharply, employment costs (wages and benefits) jumped from 1.9% y/y to 4.0% y/y (see above chart). Such increase in costs is already placing downward pressure on business profitability.
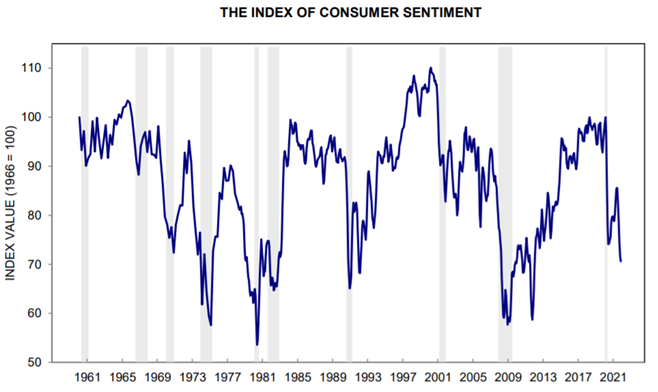
Source: University of Michigan
Consumers are responding to the increase in inflation and the resulting loss of purchasing power. Consumer sentiment is plunging to levels seen during recessions (see above chart).
Where Do We Go From Here?
M2 continues to grow at a strong pace (13.0% y/y) as the Fed keeps printing money to “finance” the government’s outlandish programs. Inflation keeps rising, further destroying consumers’ purchasing power.
Weakening demand will force manufacturing to cut inventories. Business activity will decline as business brings inventories in line with sales. The economy will enter a recession as consumers reduce spending.
The stock market will face a bear market. The business slowdown will be accompanied by slower growth in M2 and lower inflation. Yields will decline to much lower levels below 1.0% as the Fed, like the ECB and the BOJ, watches the unraveling of an ill-advised monetary policy pegging short-term interest rates to 0%.
Key Takeaways
The forces of the business cycle are unstoppable. For this reason, the Fed is in a box.
- The rise in inflation is reducing consumers’ purchasing power.
- The decline in purchasing power is reflected in slower sales.
- Business eventually cuts output to reduce costs as it faces slower sales and rising inventories.
- As business keeps downshifting, M2 growth declines from the current 13% to about 6%.
- Stock prices continue to perform poorly with capital gains from long-term Treasury bonds outperforming the S&P 500.
- Inflation declines caused by slower sales, slower production, and much slower growth in M2.
- Consumer sentiment improves.
- At that time the market resumes its bullish trend with cyclical stocks outperforming defensive stocks and bonds.


