Commodities trade in a broad range for many years and sometimes decades, states George Dagnino, chairman of Peter Dag Strategic Money Management.
An economic crisis eventually pushes them to trade around much higher levels. I am going to show the price trends of three commodities seemingly unrelated. Wall Street suggests mainly cartels and wars drive Crude Oil (CL=F) prices. The weather is the main reason for price changes of agriculturals. Copper (HG=F) prices are driven mostly by the demand by housing and industrial applications.
Let’s see what the charts are saying.
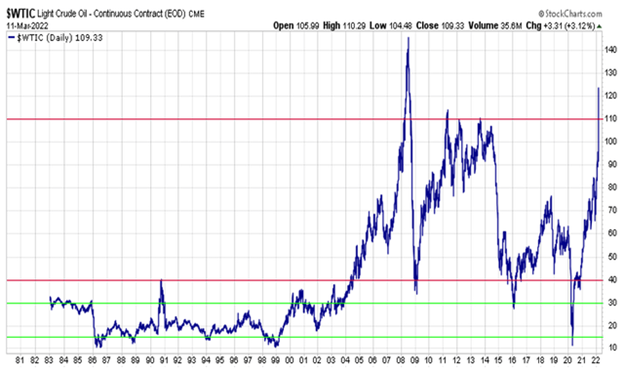
Let’s look at the first chart—crude oil.
StockCharts.com, The Peter Dag Portfolio Strategy and Management
From 1982 to 2004, for more than 20 years, crude oil traded between $15 and $30. In 2004, the price jumped and started trading in a new range from $40 to the recent $119 levels.
StockCharts.com, The Peter Dag Portfolio Strategy and Management
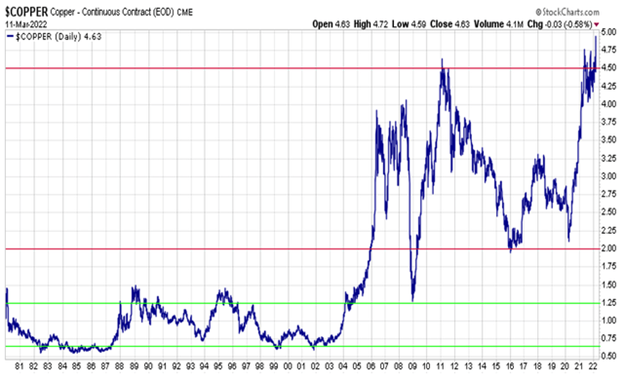
The second chart shows the price of copper. This commodity also traded in a range for more than 20 years, from 1981 to 2004. In 2004, the price of copper surged, and since 2006 it has been trading in the $2.00-$4.50 range.
Source: StockCharts.com, The Peter Dag Portfolio Strategy and Management
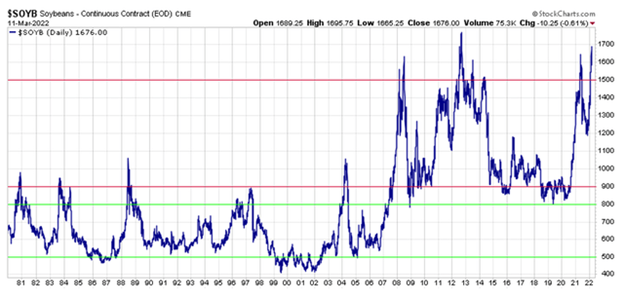
The chart of Soybeans (ZS=F)shows a surprising resemblance to the graphs of the previous two commodities. From 1981 to 2006, soybeans traded in the $500-$900 range—a 25-year span. In 2007, soybeans spiked to above $1,500 and traded in a broad range since then.
StockCharts.com, The Peter Dag Portfolio Strategy and Management
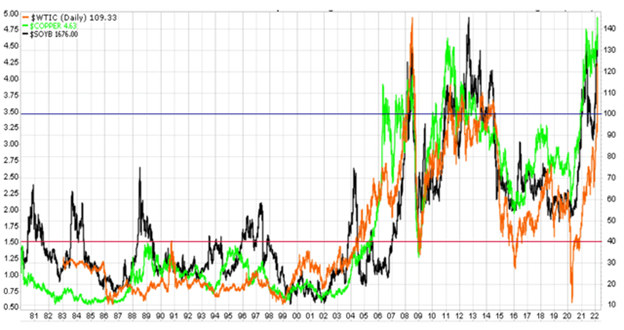
The above figure shows the graphs of the three commodities on the same chart—crude oil (red), copper (lime), and soybeans (black). They closely follow each other.
The major turning points of the graphs seem to coincide. This begs the question of how reliable is Wall Street’s view of the trend of, say, soybeans and the trend of crude oil. One is based on various weather forecasts, dryness of land, temperature ranges, and other atmospheric parameters. The price of crude oil, on the other hand, is highly discussed at all levels of government as caused by wars, cartels, production strategies, and oil company objective to maximize profits. Yet, the two commodities follow closely the same price pattern.
Subjects like growth in the money supply was followed closely in the 1970's, as Milton Friedman convinced us about the importance of the growth of money on inflation and economic growth. Since 1983, inflation and economic issues were not a major concern, so the subject has not been followed.
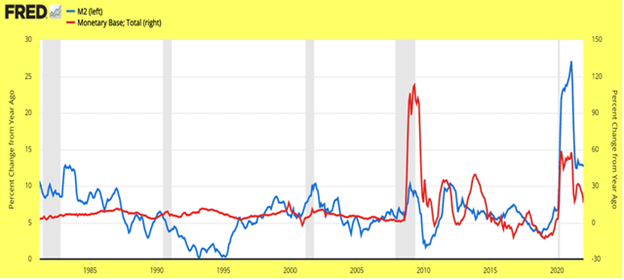
St. Louis Fed, The Peter Dag Portfolio Strategy and Management
The reason inflationary pressures are being felt by all commodities is because, since 2005, money supply growth exploded well above its historical norm of 4%-6% to cushion a financial crisis, provide economic stimulus, and social programs. Commodities surged to a new trading range and inflation eventually exploded because of the continued money printing of the Fed to finance government programs after 2020 with growth rates close to 25% y/y. The outcome has been continued volatility in commodities, equities, and soaring inflation.
StockCharts.com, The Peter Dag Portfolio Strategy and Management
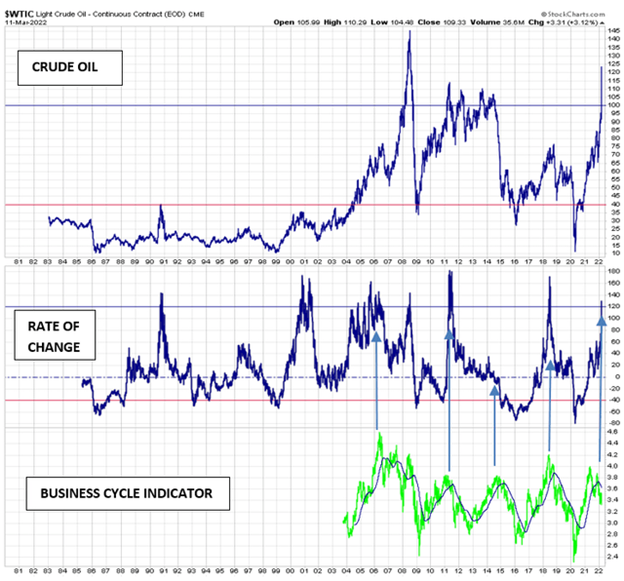
From a near-term perspective, the above chart sheds some light.
Spikes in commodity prices happen following a period of strong growth as reflected by the rising real-time business cycle indicator (lower panel), which is updated using market data in each issue of The Peter Dag Portfolio Strategy and Management (No available market data were available prior to 2004 to compute the business cycle indicator).
Furthermore, the rate of change of oil and the other commodities has soared to levels associated with a top in crude oil (middle panel of above chart).
University of Michigan
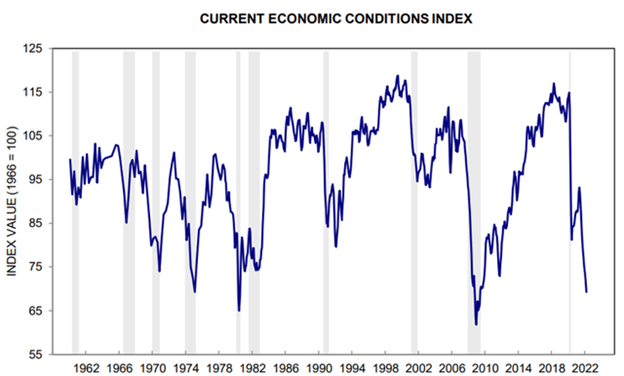
Rising inflation reduces real income (personal income is now down -9.7% y/y) and has a negative impact on consumer sentiment and demand. The outcome is the business cycle indicator declines. This is the time the above commodities decline. This is what is happening right now.
Unfortunately, the current level of consumer pessimism is one of the lowest in over sixty years and has been invariably followed by a recession (see above chart). The anticipated decline in the commodity complex reflects the incoming period of very low growth caused by weaker demand due to sagging income after inflation.
The above analysis suggests crude oil, copper, and soybeans are likely to decline as long as our business cycle indicator declines, reflecting a slowdown in economic growth.
Key takeaways:
- Surges in money supply well above 4%-6%—usually caused to accommodate government programs, wars, or financial crises as in the 1970s, 2000, and after 2020—cause sharp increases in commodities and inflation.
- The effect of excessive growth of the money supply impacts the fundamental trend of most commodities irrespective of the action by cartels, weather patterns, or housing trends.
- The current business climate is characterized by excessive inventory growth (14.7% y/y at the wholesalers’ level) when the average growth is close to 4%-5%.
- Inventories will be corrected to adapt to slower demand caused by declining personal income after inflation (down -9.7% y/y).
- The decline in inventories will be achieved by reducing production and purchases of raw materials, employment, and borrowing needs. This process will place downward pressure on crude oil and other commodities.


