

Powell acknowledges MELA & algos rally stocks as bonds start to price in a recession, states Joe Duarte, technical specialist and editor of In the Money Options.
So, the Fed raised the Fed Funds and the Discount rate, and promised six more rate increases in 2022. And the stock and the bond markets rallied.
Go figure.
Yet, as weird as it all seems, this was no accident, as I will describe below. Spoiler alert: it has to do with MELA and how stocks and bonds see things differently, and yet agree that the Fed is likely to push the economy into a recession.
Stocks Love the Rate Hikes Because of the MELA Effect
Stocks took their cue from bonds, see below, as they begin to factor in future interest rate decreases which are expected to follow the recently forecast rate increases by the FOMC.
As I’ve noted here multiple times, Mr. Powell seems to understand that he must convince the stock market that he understands the MELA phenomenon where the stock market (M) is the key to the economy (E). That’s because higher stock prices increase the value of trading accounts, crypto holdings, 401 (K) plans, and IRAs.
These are the financial instruments that many use as a gauge for making decisions about their future spending habits (L for life decisions). Moreover, the algos (A) are programmed to respond in kind based on MELA factors, positive or negative.
And here is probably the statement that sealed the MELA deal for the algos: “In making decisions about interest rates and the balance sheet, we will be mindful of the broader contexts in markets and in the economy, and we will use our tools to support financial and macroeconomic stability.”
Unless I’m mistaken, that’s Fed speak for “We will try not to screw your 401 (k) plans.”
Thus, just like that, Powell has now acknowledged the presence of MELA and its central role in how the brave new world economy really works.
And the algos clapped. And there was much rejoicing.
Can things unravel?
Of course.
But mark my words, the Fed is now aware of the MELA phenomenon. And that’s a huge deal.
Bond Market Says Recession Ahead
While the stock market put a positive spin on the possibility of six rate increases by the end of 2022, the bond market is expecting a recession. This is what Wall Street calls a policy error, which means that bond traders are betting that the rate hikes will push the economy lower.
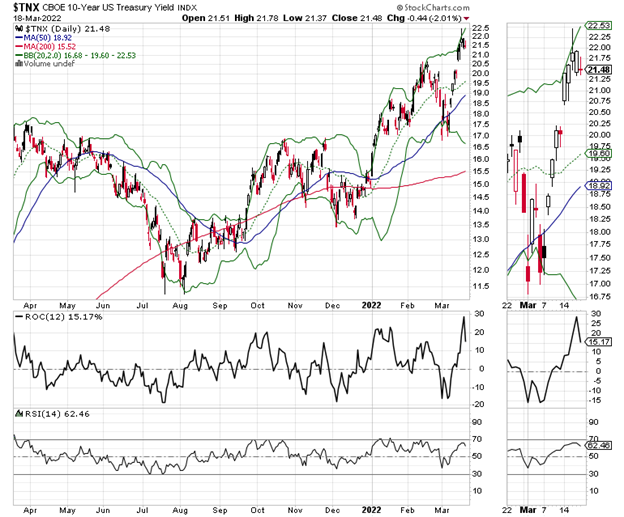
That’s why bond yields have rolled over. But when you put it altogether, at least for now, lower bond yields should cushion the blow of the Fed’s rate hikes, which in turn would benefit stocks and thus the economy.
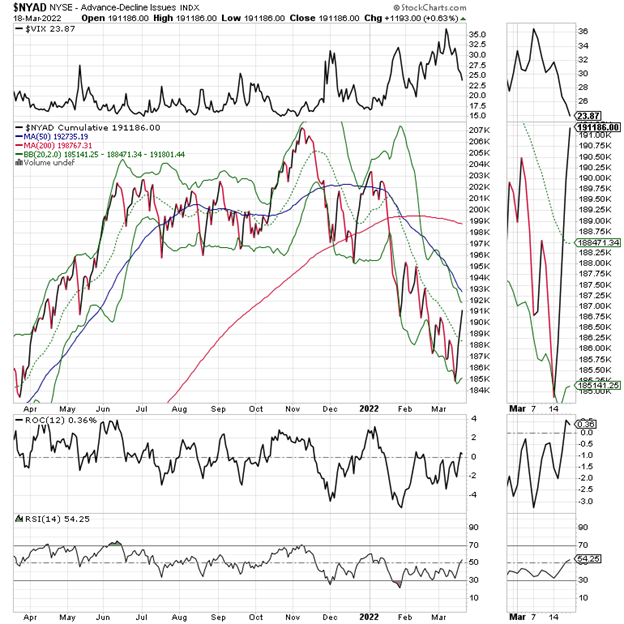
VIX Crashes. NYAD Bounces Back
The New York Stock Exchange Advance Decline line (NYAD) managed a decent bounce on Thursday and Friday of options expirations week, just a few days after closing at a new low on 3/11/22.
If this trend holds and NYAD can move higher from here, it is likely that we have seen the lows in the market for the next few days to weeks.
Meanwhile, on 3/13 in this space, I noted that Put Buyers might have been tapped out. And by the collapse we saw in the SPX Volatility Index (VIX) last week, it looks as if that assessment was correct.
A rise in VIX signals that put option volume (bets that the market is going to fall) are on the rise. What follows when put volume rises is that rising put volumes cause market makers to sell puts and simultaneously hedge their bets by selling stocks and stock index futures.
Now we have to see what happens next. If VIX continues to fall and NYAD continues to rise, we could see higher stock prices in the short term.
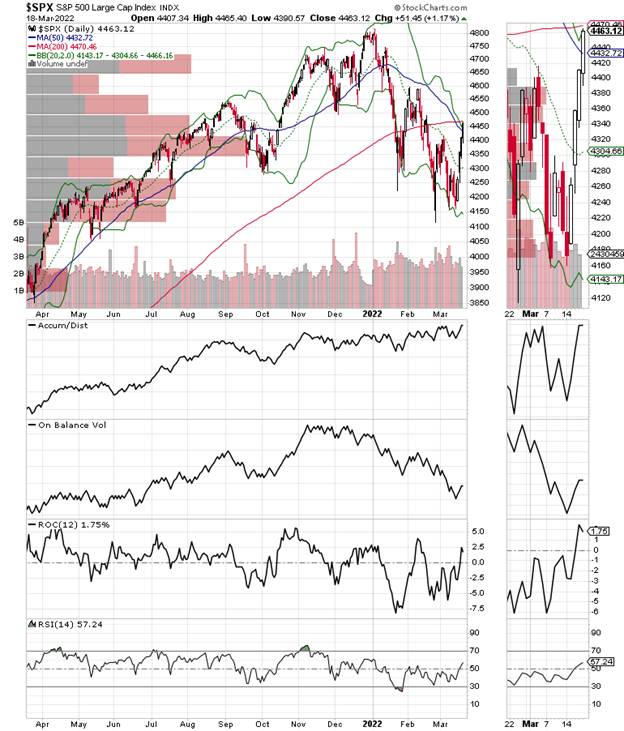
The S & P 500 (SPX) also moved decidedly higher and ended the week just below its 200-day moving average.
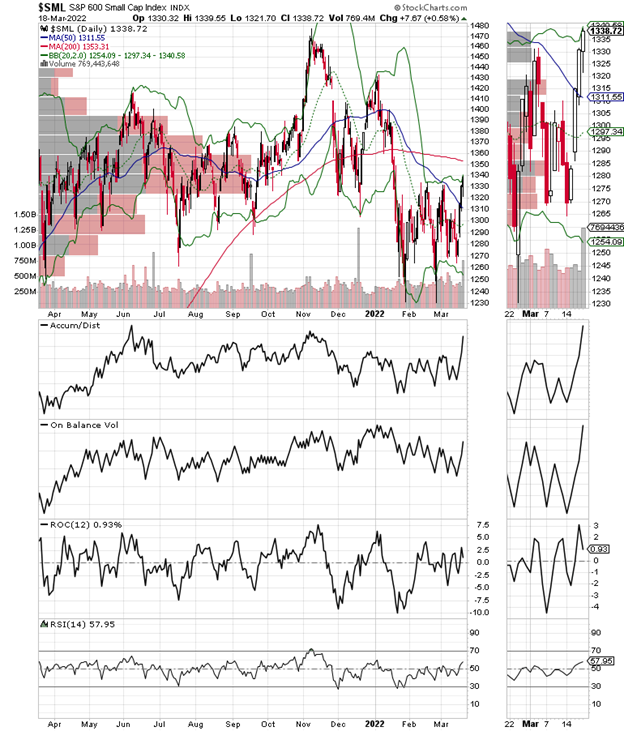
Accumulation Distribution (ADI) shot up much higher than On Balance Volume (OBV) which is usually a sign that the rally was due to short covering. That said, if OBV improves and SPX can move above its 200-day moving average decidedly then the rally could continue for some time.
4100-4300 remains the key support band while 4600 looks to be fairly tight resistance.
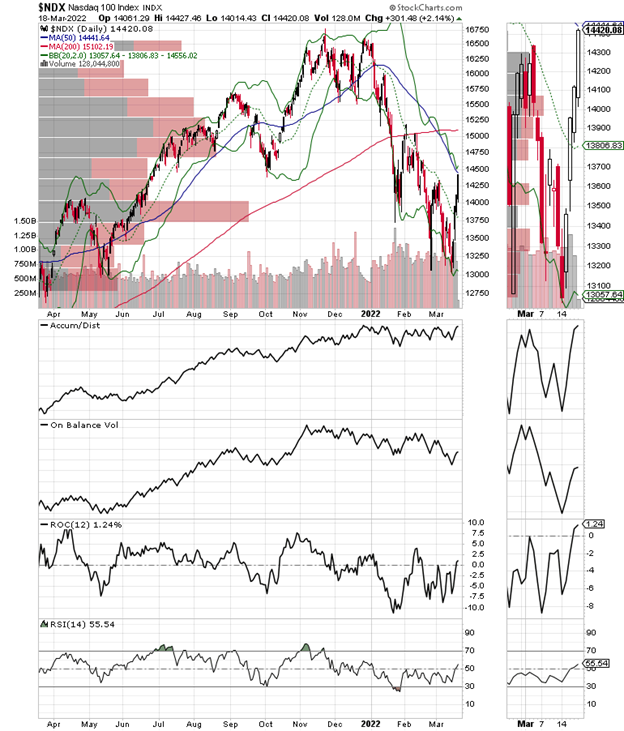
The Nasdaq 100 (NDX) index acted in similar fashion although it remains much further below its 200-day moving average.
The S & P Small Cap 600 index (SML) also bounced but its bounce is more subdued than its large cap cohorts. It too remains below its 200-day moving average.
To learn more about Joe Duarte, please visit JoeDuarteintheMoneyOptions.com.


