

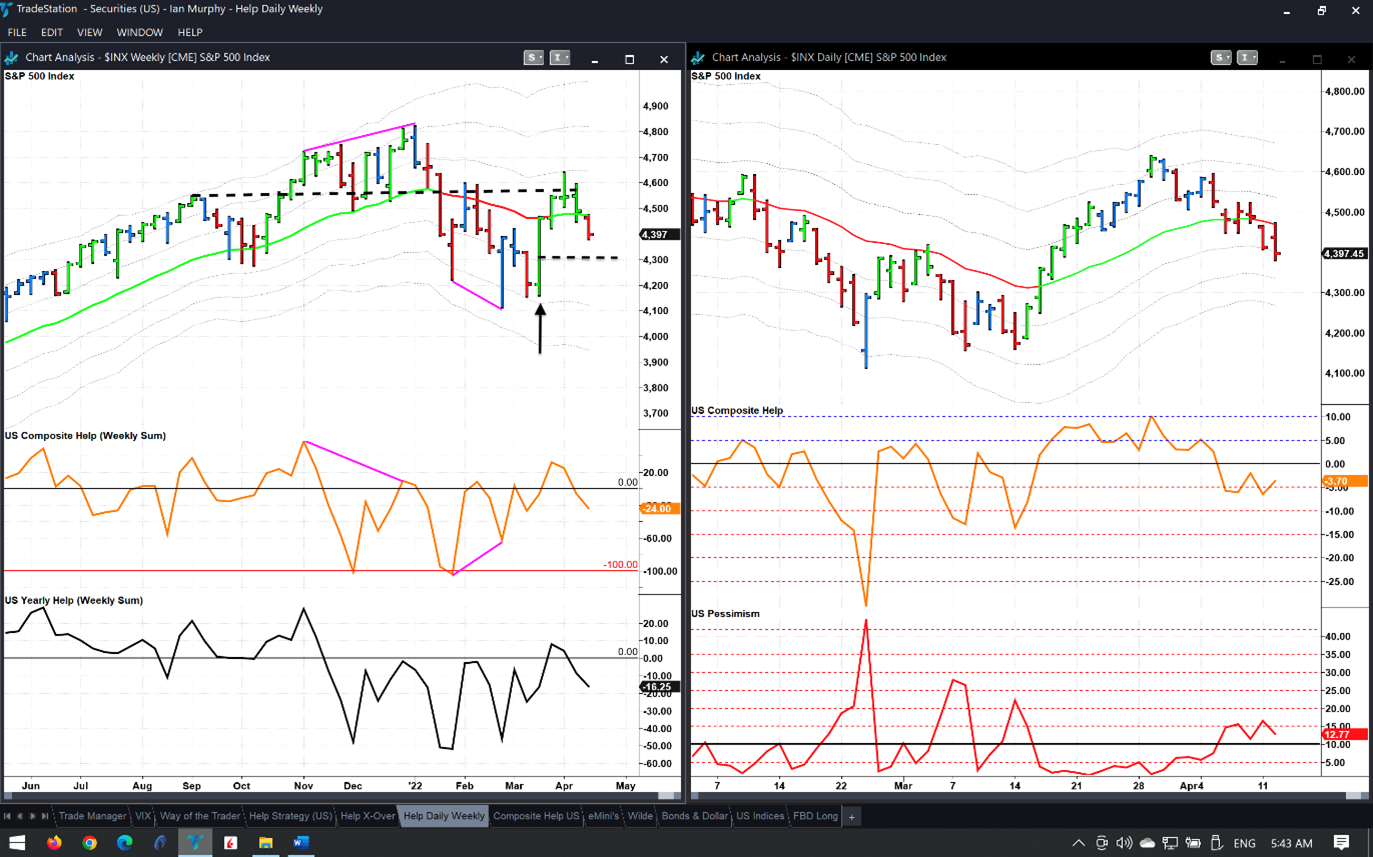
The note on April first was not a joke when it highlighted the possible formation of a first lower high pattern (1LH) on a weekly chart of the S&P 500 (SPX), exclaims Ian Murphy of MurphyTrading.com.
As you know, a 1LH pattern indicates the beginning of a new bearish trend. Another two weekly bars have printed since then (left chart), and the pattern appears to be crystalizing in the face of overhead resistance.
Click charts to enlarge
It’s too early to call a bearish trend for sure, and the index is still technically in the neutral zone, but a close below 4,300 would be confirmation. This is near the -1ATR line and a 50% retrace of the tall green bar from w/e March 18, which launched the April rally (arrow).
The daily chart on the right is already bearish as yesterday’s bar closed below the -1ATR line. Also notice we have not had a single green daily price bar so far this month, which means the EMA and MACD-H have not risen in tandem for ten consecutive trading sessions.
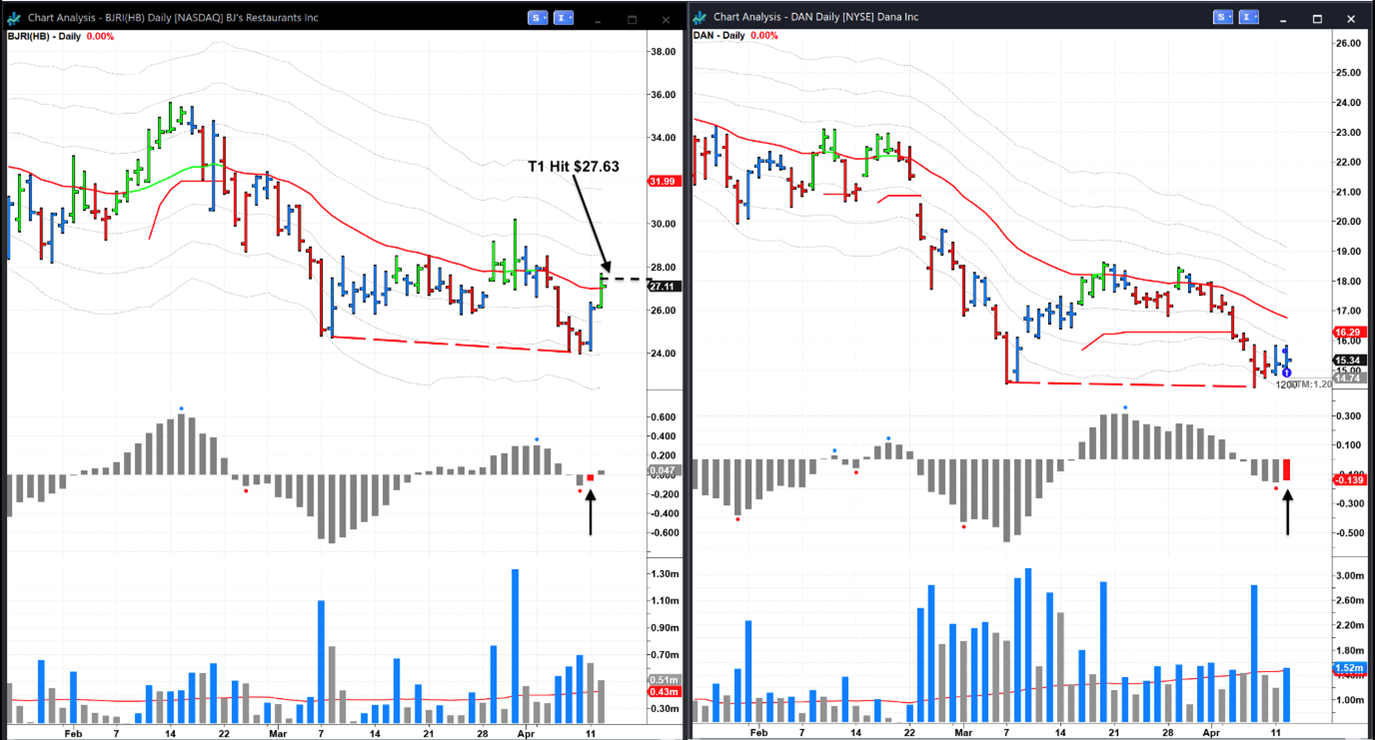
Meanwhile, I continue to try to grab pennies from in front of what may be a new bearish steamroller. BJ’s Restaurants (BJRI) printed a beautiful false downside breakout with a bullish divergence on Monday (arrow on left chart). This is almost a picture-perfect setup for the FBD strategy and sure enough, the first target was hit yesterday. Unfortunately, I missed this one in my personal account.
I did however take a trade yesterday in Dana, Inc. (DAN). The setup was not as good as BJ’s (I prefer declining volume), but the initial protective stop on 1,200 shares is shown above.
Learn more about Ian Murphy at MurphyTrading.com.


