In an article published in 2020, I wrote about the global business cycle, how business cycles and stock markets of the major countries are related among themselves, and how the US market responds to the changing global developments, states George Dagnino, chairman of Peter Dag Strategic Money Management.
This article follows the same structure as the article mentioned above and updates the data reviewed at that time.
The Global Business Cycles are Perfectly Synchronized.
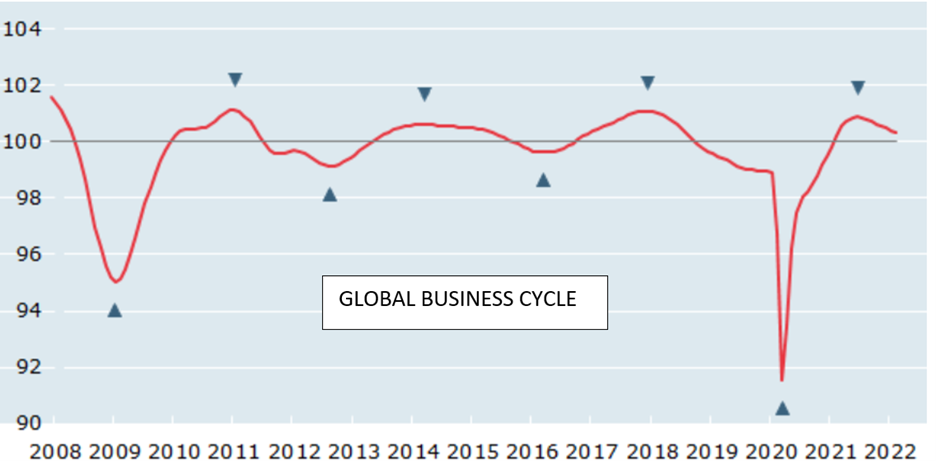
The above graph shows the leading indicator of the global business cycle as published monthly by the Organization for Economic Co-operation and Development (OECD). The arrows show the peaks and troughs of the global business cycle. The dates of these turning points are important because they will be used later.
Since 2008 the global economy experienced four business cycles: 2009-2013, 2013-2016, 2016-2020, and the current one started in 2020. The most recent global business cycle peaked in 2021 and has been in a steady decline at least since November 2021. Global growth has been declining and is likely to decline further given the leading feature of the indicator.
The global leading indicator of the OECD is also related to the business cycles of the advanced economies.
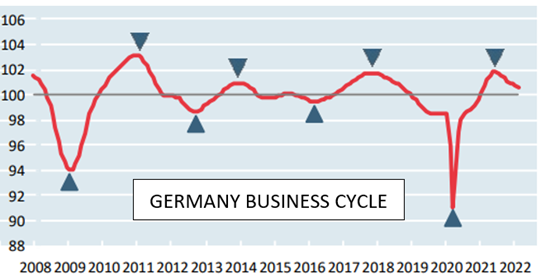
The above graph shows Germany’s business cycle. Note how the turning points coincide with those of the global business cycle.
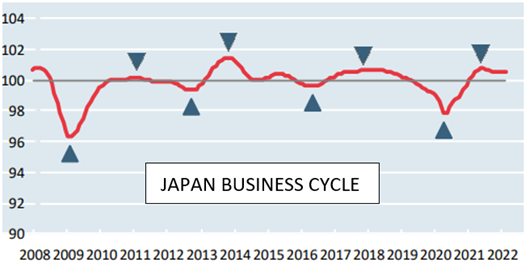
Japan’s business cycle, with a different political structure, culture, and language than Germany’s has exactly the same turning points as Germany, and of the global business cycle.
China’s Business Cycle
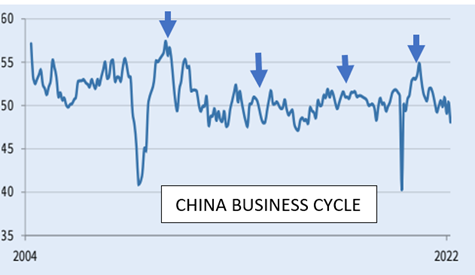
The above chart shows the performance of the general manufacturing PMI as released monthly by Caixin/Markit. The performance has been dismal at best when compared to that of other countries. Their PMI index is well below 50 when other countries are above 50, displaying growth.
The point is China’s economy, according to this indicator, has been stagnant for several years.
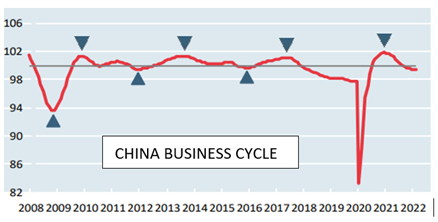
China’s leading indicator published by the OECD maintains the same turning points as other countries. The only difference is China’s gauge shows much slower growth since 2010 and is now at a level reflecting a struggling economy.
The US Business Cycle
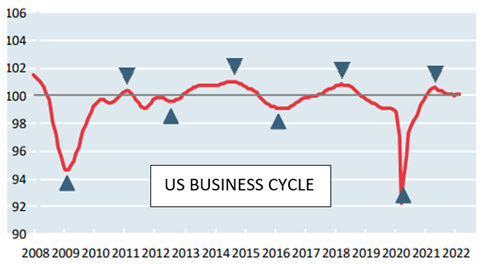
The above leading indicator of the US shows the same patterns and same dates of the turning points as for other countries. What needs to be noted is the only difference between the global business cycles is their amplitude which reflects different growth rates due to different economic policies.
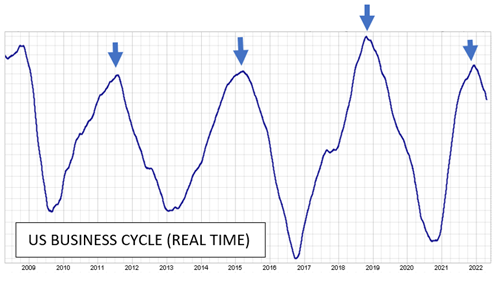
While the OECD business cycles are derived from economic data collected from each country, the above graph shows the US business cycle computed every second by The Peter Dag Portfolio Strategy and Management from market data from the NYSE.
Note how the turning points coincide with those of the global economy, Germany, Japan, and China, and of many other countries not shown here.
This synchronicity of the global economies is simply astounding and shows how closely the global economies are connected despite the different cultures and political systems. All these differences are captured in real-time by the internal market data of the NYSE and represented by the business cycle indicator which is reviewed in each issue of The Peter Dag Portfolio Strategy and Management.
This feature helps to recognize the direction of the global business cycle and the performance of global equity markets and that of China in particular.
China’s Equity Market
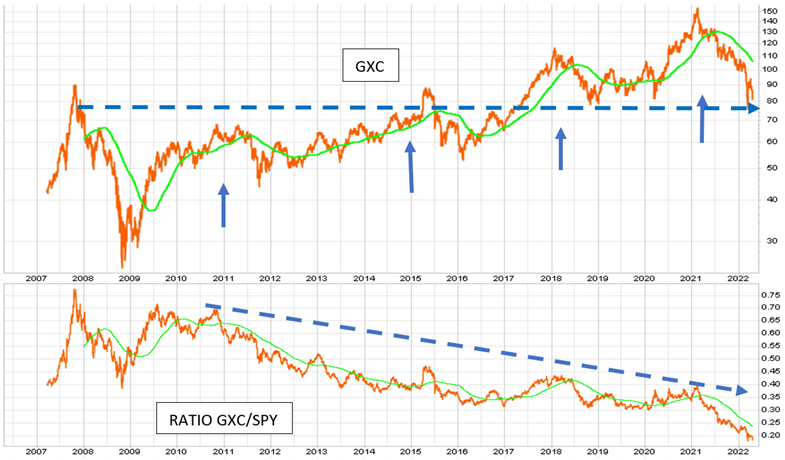
The graph in the above panel shows the performance of the Chinese Stock Market (GXC) since 2007. The lower panel shows the ratio GXC/SPY. GXC outperforms SPY when the ratio rises. GXC underperforms SPY when the ratio declines.
The Chinese market is below the levels of 2007. It has also underperformed the US market since 2010 (see lower panel).
The action of the Chinese market shows some important features.
- The Chinese market has struggled since the financial crisis of 2008, and it is now below the 2007 peak. This poor performance is consistent with the disappointing Chinese economic performance.
- The peak of each rally coincides with the peak of the business cycles of 2011, 2015, 2018, and 2021.
- The Chinese market has fallen sharply below its 200-DMA in response to renewed economic weakness.
- The Chinese market has underperformed the US market, reflecting the superior performance of the US economy as reflected by the decline of the ratio GXC/SPY since 2010.
This cyclical performance of the Chinese market is not unique.
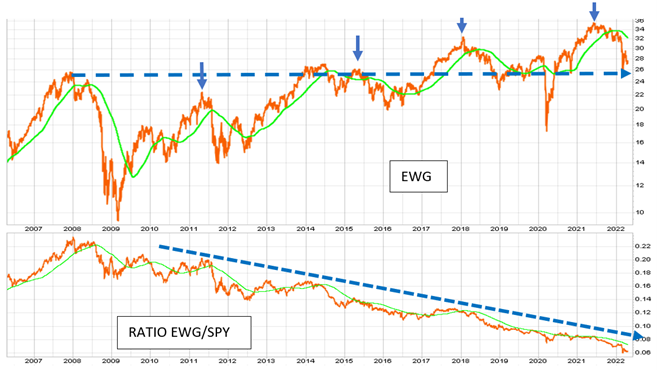
The above chart shows the performance of the German Equity Market (EWG). The lower panel shows the ratio EWG/SPY. The German market outperforms the US market when the ratio rises. The German market underperforms the US market when the ratio declines (see lower panel).
What has been said about China applies to the German market.
- The German market has struggled since the crisis of 2008, and it is now close to its 2007 peak.
- The peak of each rally coincides with the peak of the business cycles of 2011, 2015, 2018, and 2021.
- The German market is sagging below its 200-DMA in response to renewed economic weakness.
- The German market has underperformed the US market, reflecting the superior performance of the US economy.
Many other equity markets show the same features, and they are reviewed in each issue of The Peter Dag Portfolio Strategy and Management with their buy/sell signals. The point is that the global equity markets and the global business cycle are perfectly synchronized.
Key Takeaways
- The turning points of the business cycle of the major economies take place at the same time.
- The turning points of the global business cycle coincide with the turning points of the business cycle indicator computed in real-time from the NYSE market data and reviewed in The Peter Dag Portfolio Strategy and Management.
- The global equity markets have the same turning points which coincide with the turning points of the business cycle.
- China’s equity market follows the pattern of other foreign equity markets.
- China’s equity market has been performing poorly since 2007, reflecting poor economic conditions. It is likely to continue to show disappointing performance given the weakness and downtrend of the US and global business cycle.
- Rising commodities, inflation, interest rates, and declining purchasing power will force the Chinese and other equity markets to decline.
- Chinese and other major equity markets will rise following a decline in commodities, inflation, and interest rates.


