

Stocks have had trouble making a sustained move of late, says Larry McMillan of Option Strategist.
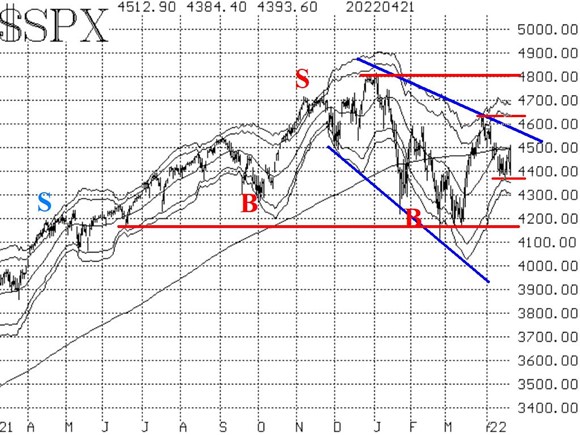
In Figure One, the major trend of the S&P 500 (SPX) is down (blue lines). However, within those trend lines, SPX has been tightly range-bound between 4380 and 4500 for the past week. In more "normal" times, a 120-point range for SPX over a week would be a lot of movement, but not in today's market.
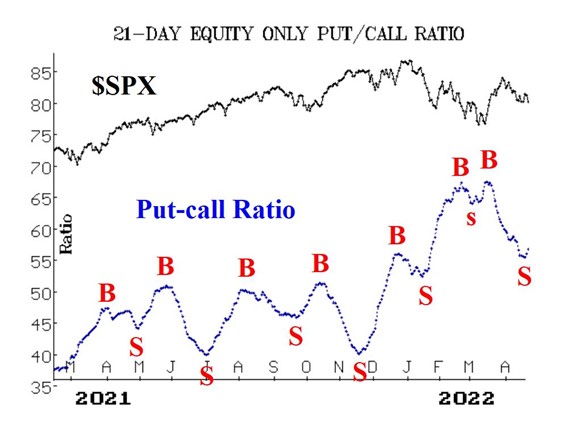
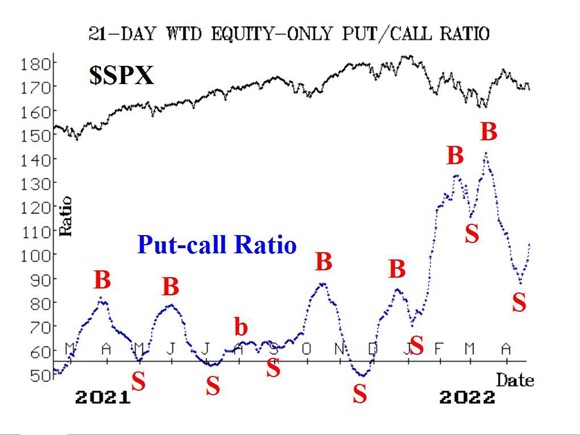
In a somewhat surprising development, both equity-only put-call ratios have turned upward, and both are on official sell signals, according to the computer programs that we use to analyze these charts. While these sell signals did not emanate from the lower regions of their charts, they must still be respected, as similar-level sell signals in January proved to be quite accurate.
Market breadth continues to reverse direction more often than we'd like to see. This has caused the breadth oscillators to swing from sell signals to buy signals and back again numerous times this year.
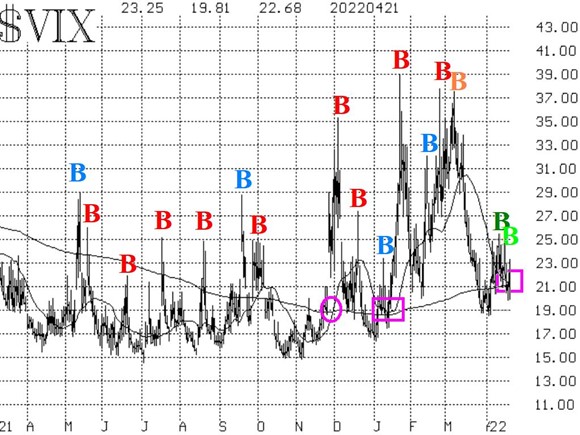
Currently, they are on sell signals once again. There is a VIX "spike peak" buy signal in effect. However, the trend of the CBOE SPX Volatility Index (VIX) is still negative. VIX would have to close below 18.50 in order to change that and seems unlikely in the near term.
Overall, the picture is still mixed. Just when it appears that the internal indicators might be improving, they fail again: equity-only put-call ratio sell signals, breadth oscillator sell signals, and new lows dominating new highs once again. So, we are still maintaining a "core" bearish put spread position and will trade other short-term indicators as signals occur.


