

Get out your 2015 playbook; equity benchmarks are right in the thick of an August 2015 type selloff, asserts Bill Baruch, president of BlueLineFutures.com.
In Friday’s Morning Express, we noted the US Dollar (USD=X) had its strongest week against the Chinese Yuan or Renminbi (CNYUSD=X) since the week of August tenth, 2015. Of course, this was not a one-week event, but the Yuan’s demise during that week in 2015 was merely one domino amid a chain that was years in the making.
First and foremost, we believe that market themes that once took years to play out can now unfold in half the time or less.
For instance, the S&P 500 (SPX) topped in October 2007 due to the Great Financial Crisis and did not set a new record high until April 2013, five and a half years. In 2020, the S&P topped in February and did not set a new record high until August, only six months.
(charts deck below)
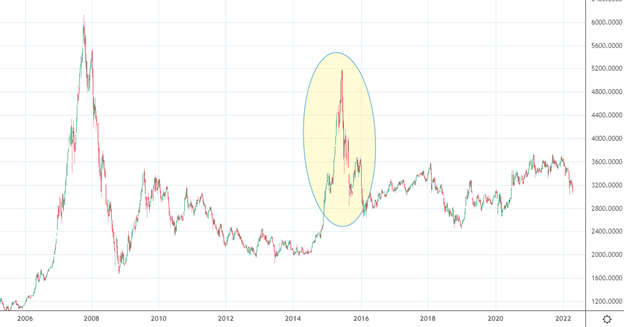
From 2007 through the end of 2014, the Federal Reserve’s Balance Sheet expanded from $865 billion to a peak of $4.5 trillion. The run to a 2013 record high in the S&P certainly found tailwinds from the Fed’s accommodative policies. The S&P made a low in March 2009, and after chopping constructively higher, it was poised to break out at the end of 2012.
A trend line from the low in November of 2012 provided a smooth path and a 33% gain to a September 2014 high before breaking it the next month. Volatility was created in 2013 when the Fed announced it would taper its bond purchases. Although the announcement did not immediately derail the stock market, the yield of the ten-year went from a low of 1.6% in April 2013 to 3% in September 2013.
In the recovery from the Great Financial Crisis, foreign policy and the exportation of manufacturing paved the way for massive growth in China. By 2014, China’s Yuan became one of the world’s top five payment currencies, supplanting both Canadian and Australian dollars. That growth led to a stock market bubble that began in 2014. The Shanghai Composite gained 160% at its peak in June 2015 and then collapsed by 45% through August. The People’s Bank of China devalued the Renminbi (Yuan) in August to help buoy the economy amid the stock market bubble popping. As a result, the Yuan lost as much as 6% and finished down 3.8% against the US Dollar during the week of August tenth.
Coupled with the Shanghai Composite’s crash, it caused great stress across the global financial system.
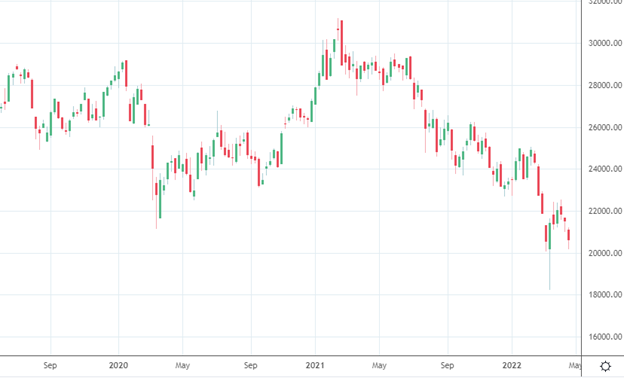
Fast forward to the present day, a trend line in the S&P began in November 2020, after the March 2020 low, and lasted through September 2021 for a gain of 41%. The Federal Reserve’s Balance Sheet went from $4.2 trillion in February 2020 to currently just under $9 trillion. The Fed announced in November that it would begin tapering its balance sheet, and similar to 2013 through 2014, choppy record highs were underway, and the yield of the ten-year has risen from 1.3% in December to 2.9% today.
Policy in China related to reining in public companies and zero-virus tolerance has weakened the Shanghai Composite by 17%, but it is the China-tech-heavy Hang Seng that has been slashed by 41%. China’s Yuan weakened by 2.3% last week, as noted, its worst week since August tenth, 2015.
Many dominos have fallen in recent weeks, but as one can see, there are many similarities between the Great Financial Crisis recovery and the virus recovery. So, how do we trade this? Patience, because those similarities do not stop at a macro perspective, but even within the intraday tape. The S&P rolled out of bed the week of August 17, 2015, losing 5.7%. Friday, August 21 reached a low and bounced during that final hour, but it was the final minutes, similar to this last Friday, where the tape was hammered into the electronic close.
Next, an absolute bloodbath came on Monday, August 24, when the S&P lost as much as 7.1%. However, there is good news; it became a low for five months, and there was an abundant opportunity during a 14% run through November. In fact, that low was probed in January and February 2016 but was ultimately rejected, and a generational bottom was formed.
This all plays into the hand we are calling for. As we look to the Federal Reserve’s policy meeting on May fourth, we believe they need to set a very hawkish tone and front load as many rate hikes as possible. They need to shock the system, rein in prices, and inflation will follow.
We will leave you with this; Core CPI for Q1 2021 averaged 1.4% and for June-August 2021 averaged 4.3%. There will be higher base comparisons in the coming months, and the stage is set for inflation to normalize, something that we believe will pave the way for fresh record highs sometime between August and October of 2022.
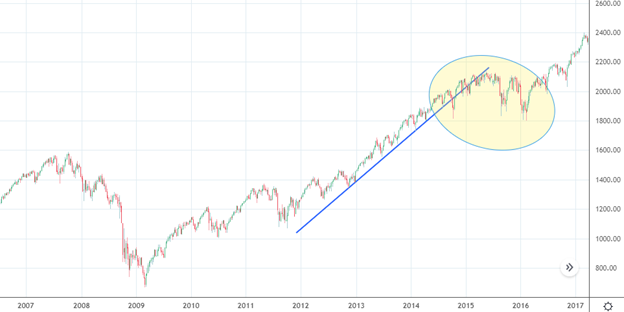
S&P weekly 2007 - 2016
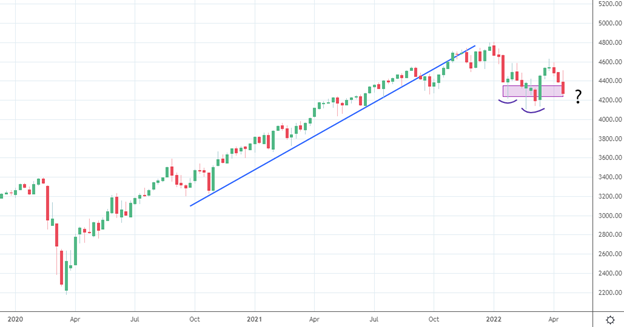
S&P weekly 2020 - present
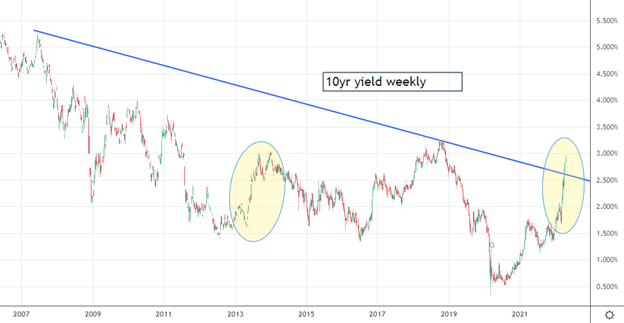
10-year yield weekly
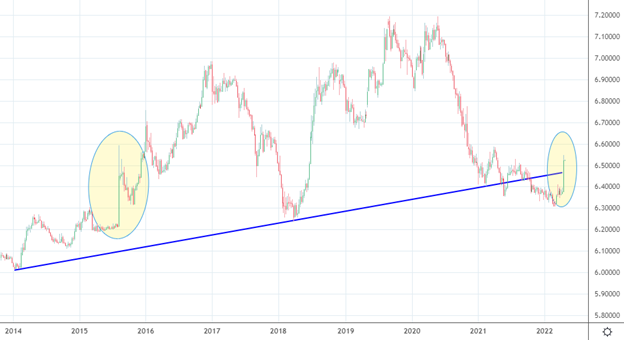
US Dollar / Chinese Yuan weekly
Shanghai Composite weekly
Hang Seng weekly
Learn more about Bill Baruch at Blue Line Futures.


