

The downtrend continues to start in May, notes Bonnie Gortler of bonniegortler.com.
For the week, five of the eleven S&P SPDR sectors were up, Energy (XLE), the star performer in 2022, and Utilities (XLU) were the strongest, while Consumer Discretionary (XLC) and Real Estate (XLRE) were weakest. The SPDR S&P 500 ETF Trust (SPY) was down -0.60 %.
4/29/22 – 5/06/22 S&P SPDR Sector ETFs Performance Summary
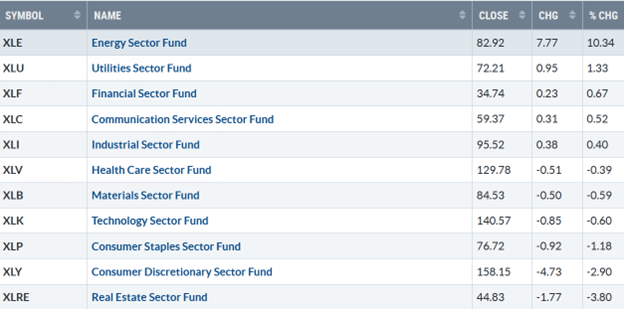
Source: Stockcharts.com
Figure 2: Bonnie's Mix of ETFs Performance Summary 4/29/22 – 5/6/22
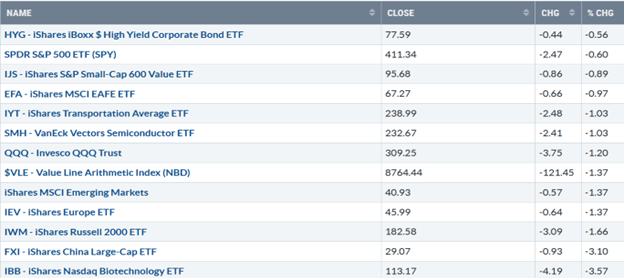
Source: Stockcharts.com
Despite the S&P 500 (SPX) only down -0.6%, the decline was broad. Last week was high intraday volatility. Market sentiment shows fear, with the CNBC Fear and Greed Index (a contrary indicator) closing at 31 in the fear zone. The AAII sentiment survey continues to show pessimism above its historical average.
Figure 3: UST 10-YR Bond Yields Daily
Source: Stockcharts.com
The 10-Year US Treasury (TNX) yields rose last week, closing at 3.123%. The upside target of 3.42% remains. The Five-Year US Treasury yield also rose last week, closing at 3.06% (Figure:4), the highest yield since 2018.
Figure 4: UST 5-YR Bond Yields Daily
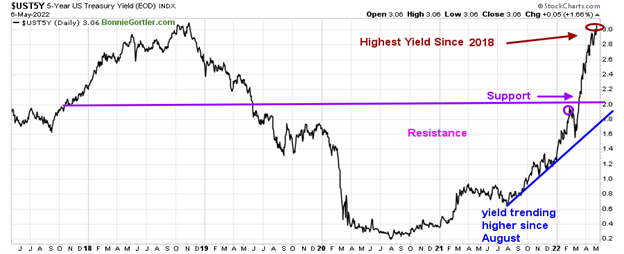
Source: Stockcharts.com
The Dow (DOW) fell -0.24% for the week. The S&P 500 was down -0.21%, and Nasdaq (NDX) fell -1.54%. The Russell 2000 Index (RUT) was down -1.32%, while The Value Line Arithmetic Index (a mix of approximately 1700 stocks was down -0.96%.
Weekly market breadth was negative for New York Stock Exchange Index (NYSE) and Nasdaq. The NYSE had 950 advances and 2321 declines, with 112 new highs and 1101 new lows. There were 1784 advances and 3512 declines on the Nasdaq, with 161 new highs and 1718 new lows.
The daily Nasdaq advance-decline line peaked in February 2021 and continues to make lower lows. Market breadth remains negative. Until this changes, it will continue to be more of a challenge to make money from the long side.
Risk management with a focus on Safety and Capital Preservation remains a priority. For a major market bottom to occur, improved market breadth is needed. Keep a close eye for several days of more advances than declines, with new lows contracting below 150 for the first sign of a potential upside reversal.
Figure 5: CBOE Volatility Index VIX
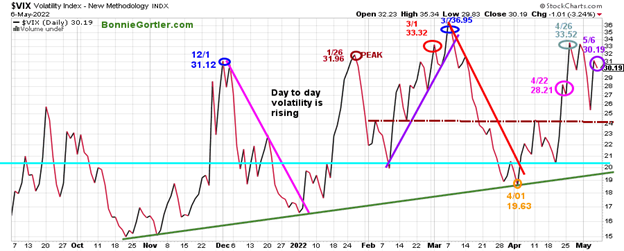
Source: Stockcharts.com
The CBOE Volatility Index (VIX), a measure of fear, has been trading above 20.00 for most of 2022. In January, VIX made a high at 31.96 on 1/26 (brown circle), on 3/1 at 33.32 (red circle), and 36.95 on 3/7 (blue circle).
Last week, VIX fell to 30.19 (purple circle), remaining below the March and April peak. Expect more day-to-day volatility until VIX closes at a minimum below 24.00 and below the 4/01 April low (orange circle) at 19.63.
If you are day trading, adjust your size of trades to be smaller and keep tight stops if the decline continues to accelerate lower to manage your risk.
Figure 6: Daily New York Stock Exchange (NYSE) New Lows
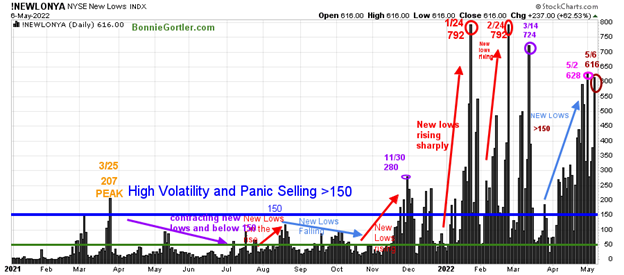
Source: Stockcharts.com
Watching new lows on the New York Stock Exchange is a simple technical tool that helps awareness of the immediate trend's direction. New lows warned of a potential sharp pullback, high volatility, and "panic selling" for most of 2022, closing above 150.
Here is an excerpt from my book: "When new lows are above 150, the market is negative, higher risk, and selling is taking place. Sometimes it could be severe, and sometimes on a very nasty day, you can have 'panic selling,' and big wild swings (high volatility) to the downside may occur."
As the market started to move lower in January, new lows rose sharply, peaking at 792 on 1/24 (red circle), and then contracted but not enough to be in a low-risk zone before rising again on 2/24 at 792, matching the 1/24 peak. In March, things were looking better as new lows fell below 150, and a rally began, but it was short-lived.
Last week, new lows expanded from the previous week closing at 616 on 5/7 (brown circle), but less than on 5/2 reading of 628 (pink circle), a promising sign. Risk remains of further downside in the near term until new lows contract to below 150 and then fall between 25 and 50.
Figure 7: Daily iShares Russell 2000 (IWM) Price (Top) and 12-26-9 MACD (Middle) and Money Flow (Bottom)
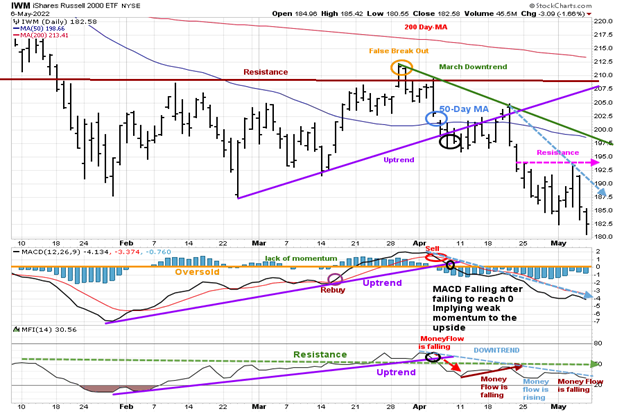
Source: Stockcharts.com
The top portion of the chart is the daily iShares Russell 2000 Index ETF (IWM), the benchmark for small-cap stocks, with a 50-Day Moving Average (MA) (blue line) and 200-Day Moving Average (MA) that traders watch and use to define trends.
IWM had the potential to break out to the upside, but in late March, IWM failed to break out above resistance at 210.00 (orange circle) and turned lower, forming a downtrend. IWM remains in a downtrend, closing below the 50-Day MA (light blue circle), closing at 182.58 down -1.66%. Short-term resistance is 195.00, 200.00, and 210.00. Support is at 180.00, 177.00, followed by 170.00.
MACD (middle chart) remains on a sell, below zero, falling with downside momentum continuing. Money Flow (lower chart) turned up and is close to breaking the April downtrend.
Note: IWM for the intermediate-term stalled under resistance at 210.00, and MACD remains in a downtrend. Nasdaq remains weak, continuing its short-term downtrend.
Figure 8: Daily Invesco QQQ Trust (QQQ) Price (Top) and 12-26-9 MACD (Bottom)
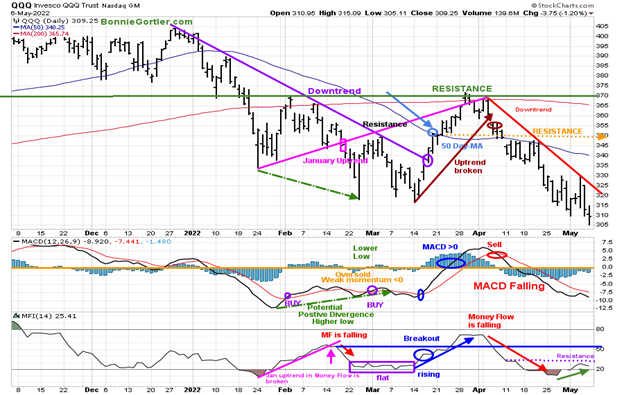
Source: Stockcharts.com
The chart shows the daily Invesco QQQ Trust (QQQ), an exchange-traded fund based on the Nasdaq 100 Index with its 50 and 200-Day Moving Average. QQQ accelerated lower after breaking the January uptrend (pink rectangle), penetrating the January lows.
After breaking the March uptrend (brown line) at 355.00, QQQ has been under heavy selling pressure, and the short-term trend remains down (red line). Last week QQQ fell -1.28%, closing at 309.25, remaining below its 50-Day and 200-Day Moving Average, unable to penetrate the downtrend on the big up day, and then immediately reversed lower the next day. Resistance is at 325.00, 330.00, 350.00, followed by 370.00. Support is at 300.00, followed by 290.00.
The middle chart is MACD (12, 26, 9), a measure of momentum that remains on a sell, oversold below zero and falling. Money Flow (lower chart) trended lower in April but has turned up from an oversold condition. However, so far unable to get above resistance (purple dotted line).
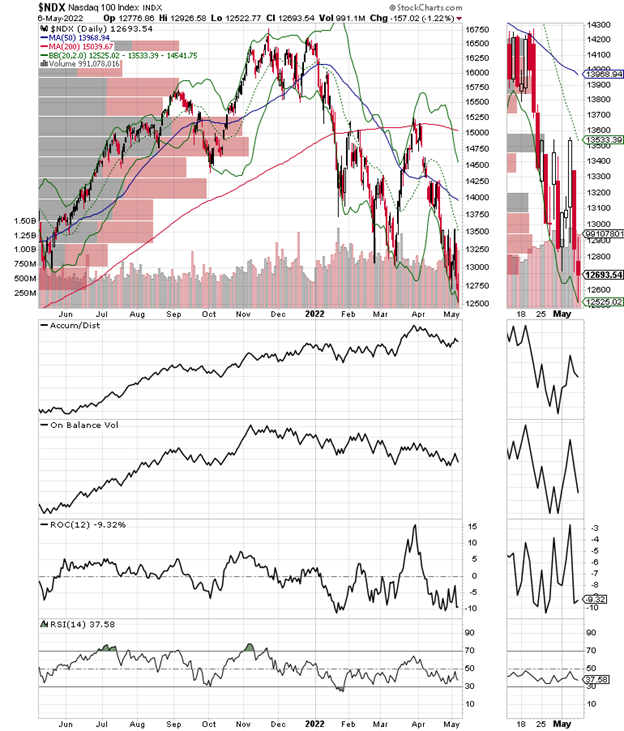
Figure 9: Weekly Invesco QQQ Trust (QQQ) Price (Top) and 12-26-9 MACD (Bottom)
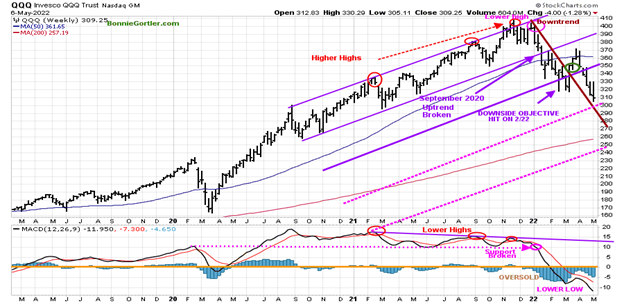
The top chart shows the weekly Invesco QQQ Trust (QQQ) making higher highs peaking in November 2021 (red circles) but failed to make a new high in December 2021 and then hit its 325.00 downside objective on 2/22. The downside objective is 300.00, followed by 250.00. Resistance is at 330.00, followed by 360.00
MACD (lower chart) remains on a sell after making lower highs (red circles) and breaking below support held since February 2020 (pink dotted line), implying weak underlying momentum. MACD remains deeply oversold, below zero, falling, and below the March momentum low. Be patient and wait for a safer reentry.
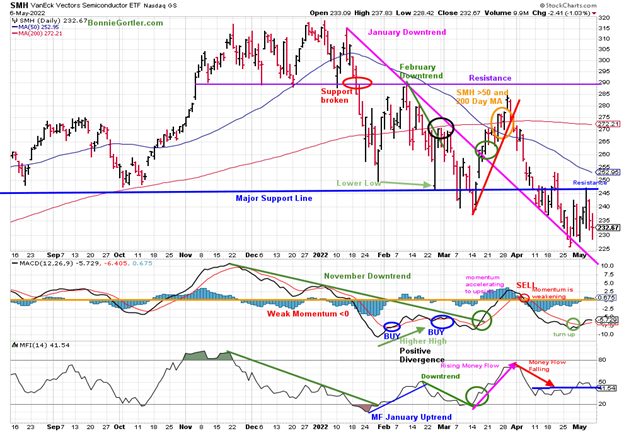
Figure 10: Van Eck Semiconductors (SMH) Daily Price (Top), 12-26-9 MACD (Middle), and Money Flow (Bottom)
Stockcharts.com
In late January, Van Eck Semiconductors (SMH) support was broken (red circle) and then fell sharply but held the October 2021 lows. SMH then rallied but turned down again, closing below support at 240.00 on 3/14/22, a false breakdown. SMH broke the March uptrend (red line) after failing to get above resistance and fell for five consecutive weeks. SMH this week was positive, gaining +1.23 %, closing at 232.67. However, it still has work to do since it remains below its 50 and 200-Day Moving Averages.
Support is at 220.00, and resistance remains at 245.00, followed by 255.00. MACD (middle chart) is now on a buy (green circle) but not yet accelerating higher or above zero, showing internal strength.
Money Flow (lower chart) has been trending sideways since April 11 but broke out of its April consolidation, but has turned lower. Time will tell if Money Flow begins to rise again.
Positive Development: SMH is now leading in relative strength compared to the QQQ and has broken the January Downtrend.
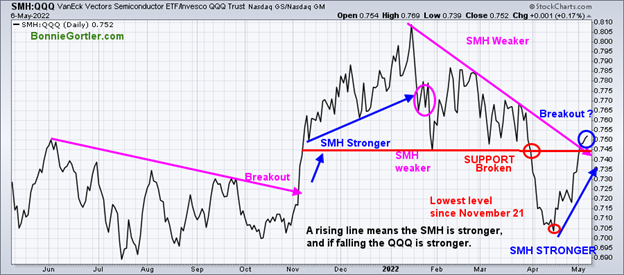
Figure 11: Daily Relative Strength Ratio Semiconductors (SMH)/ Invesco QQQ Trust (QQQ)
Stockcharts.com
A rising line means the SMH is stronger, and if falling, the QQQ is stronger. SMH is leading in relative strength compared to QQQ. SMH has been weaker than QQQ since early 2022. It’s a positive sign that the SMH /QQQ ratio broke above the previously broken support and has broken the 2022 downtrend. Continued outperformance in SMH compared to QQQ would be positive for US Equities.
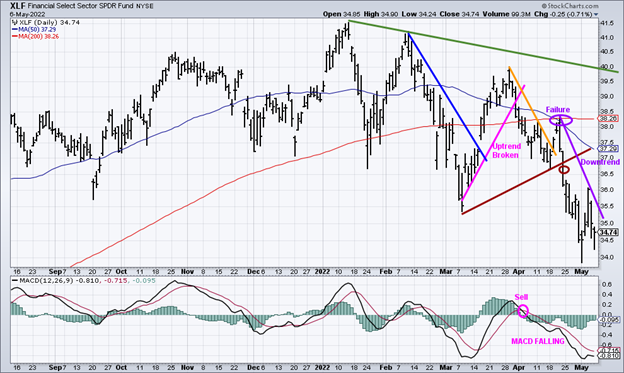
Figure 12: Financial Select SPDR (XLF) (Top) and 12-26-9 MACD (Bottom)
Source: Stockcharts.com
The 2022 short-term downtrend in Financials (XLF) remains (green line). After breaking its March uptrend (pink line), XLF moved lower, followed by XLF breaking its March downtrend that failed at its 50 and 200 Day-MA (purple circle). Financials (XLF) bucked the trend last week, gaining 0.67%.
MACD remains on a sell, below zero, and falling. The good news is a potential double bottom is forming. However, until XLF closes above 36.25 and MACD turns up, the risk remains of further downside.
Summing Up
A volatile week to the up and downside. What appeared to be an upside reversal wound up another selling opportunity for bears. The short-term trend remains down, with momentum patterns oversold but not yet favorable. Be alert to a possible short-term bounce early in the week if semiconductors and small caps lead the way higher. However, for a sustainable rally, more time is needed for downside momentum to slow and a safer buying opportunity to present itself.
Remember to manage your risk, and your wealth will grow.
Do you like charts? I would love to hear from you. If you have any questions or comments, or if you would like to talk about the market, email me at Bonnie@Bonniegortler.com
Disclaimer: Although the information is made with a sincere effort for accuracy, it is not guaranteed that the information provided is a statement of fact. Nor can we guarantee the results of following any of the recommendations made herein. Readers are encouraged to meet with their own advisors to consider the suitability of investments for their own particular situations and for determination of their own risk levels. Past performance does not guarantee any future results.


