Realized volatility is exploding as the market swings wildly from one direction to the other, says Larry McMillan of Option Strategist.
Both two weeks ago and this last week saw extremely large oversold rallies that rivaled some of the largest "up days" in history.
Both were immediately followed the next day by selling of a major magnitude, that more than wiped out those rallies—and were some of the largest "down days" in history.

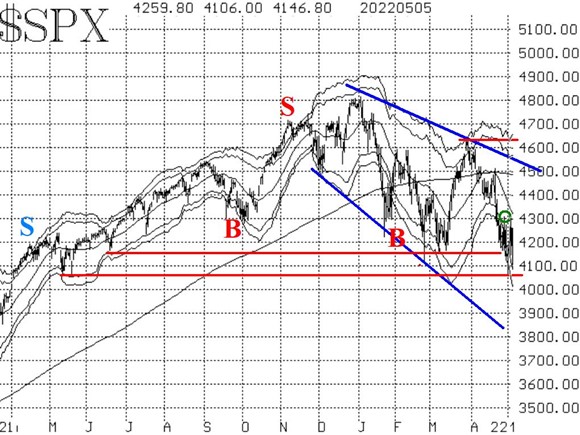
The chart of the S&P 500 (SPX) remains in a downtrend (note the blue trendlines in Figure One). That alone is enough to retain a "core" bearish position. The bulls are not giving up easily, though. The support in the general area of 4100 has continued to hold. One can see from the lowest horizontal red line on the chart, that $SPX is now back at the lows of May 2021.

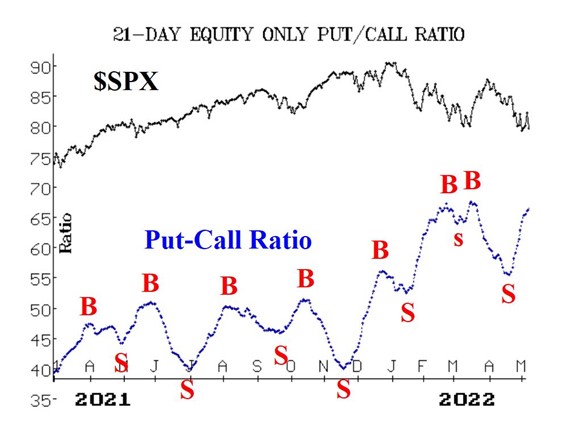
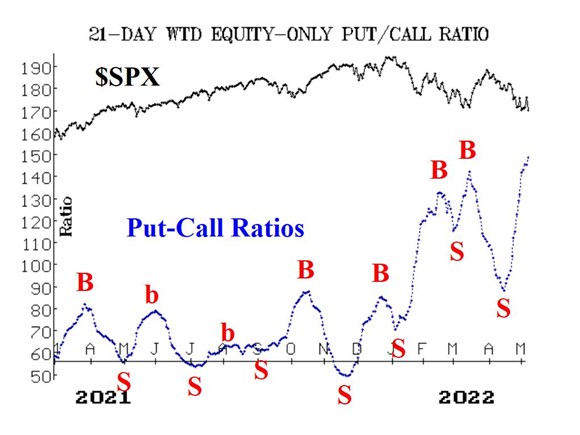
Equity-only put-call ratios remain on sell signals, as they continue to rise. The weighted ratio is now back at levels last seen in April 2020, when the ratios were declining from their March 2020 highs.
Market breadth has swung back and forth to extreme levels, in keeping with the wild swings in the stock market. Currently, the breadth oscillators are back on sell signals after the extremely negative action of May fifth. That was a "90% down day"—the third one since April 22. An accumulation of "90% days" in both directions is a sign of a bearish market.

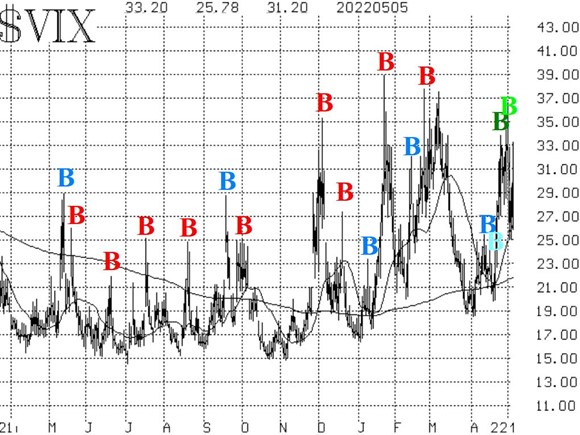
CBOE SPX Volatility Index (VIX) has remained relatively elevated, although $VIX is nowhere near as high as it has been in previous stock market declines of this magnitude.

The trend of VIX remains in a bearish state for stocks. That is, both $VIX and its 20-day Moving Average continue to trade above the 200-day MA.
In summary, the trends of SPX (downward) and VIX (upward) continue to call for one to hold a "core" bearish position. Due to the oversold conditions which exist, confirmed (buy) signals from the other indicators can be traded around that core bearish position.


