Stocks continued to fall last week, after the last failed "one-day wonder" rally on May fourth, says Lawrence McMillan of Option Strategist.
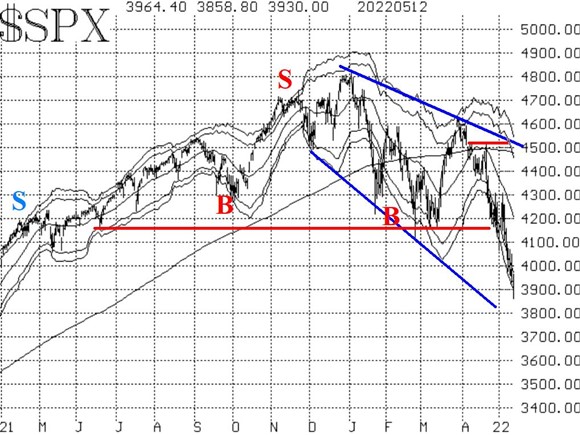
Support was broken at 4,100, which quickly saw the S&P 500 (SPX) trade down below 3,900. There is some support at that level, but there is a more well-defined support level at 3,700 (the lows of February and March 2021). Needless to say, the chart of $SPX remains in a downtrend (blue lines in Figure One).

There are massively oversold conditions in put-call ratios, breadth, and New Highs vs New Lows, but an oversold market is always dangerous. It can continue to decline sharply even while oversold.
Any rally is likely to fail in the 4,200-4,300 area.

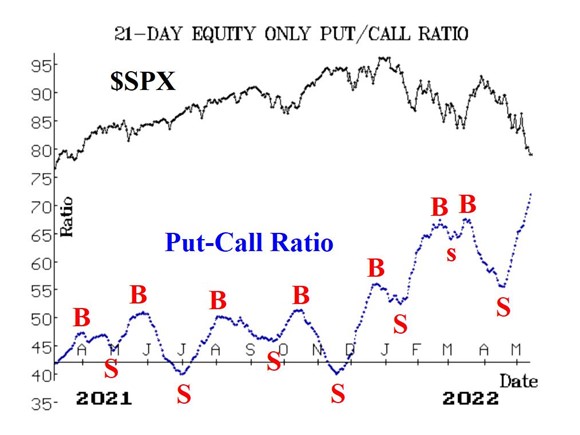
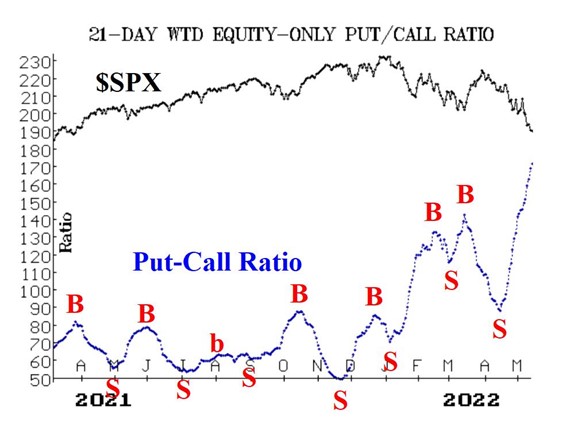
Equity-only put-call ratios continue to rise, so they remain on sell signals. They are quite high on their charts, meaning they are oversold, but they were higher in March of 2020. They will not generate buy signals until they roll over and begin to decline.

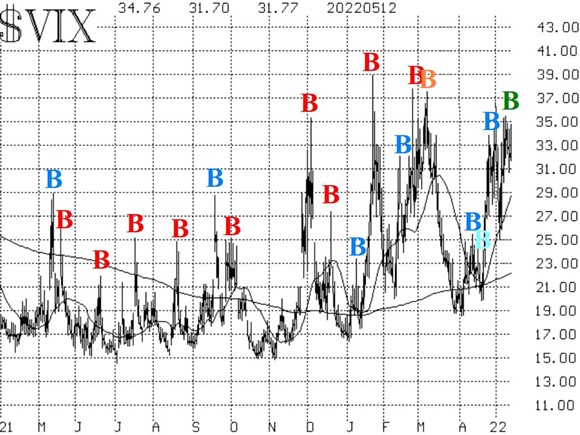
Both breadth oscillators remain on sell signals, but they are deeply oversold. From these levels, it is going to take at least two or three days of positive breadth, just to get a buy signal. VIX continues to be in its own world. First of all, the previous "spike peak" buy signal was stopped out on Monday, but by Thursday a new one had set up.
It is marked with a green "B" on the chart in Figure Four.

The trend of CBOE Volatility Index (VIX) remains negative for stocks, though, as both $VIX and its 20-day Moving Average are well above the 200-day MA. Currently, that 200-day MA is at about 22 and rising. $VIX would have to fall below that in order to "stop out" the intermediate-term sell signal that is in place.
In summary, we continue to maintain a "core" bearish position because of the trends of $SPX (downward) and $VIX (upward). Of course, we recognize the oversold conditions represent strong, but probably short-lived, rally potential, so we will trade any confirmed buy signals around the "core" bearish position.


