

Despite Friday’s gains, the overall market remains unstable, notes Bonnie Gortler of bonniegortler.com.
Only one of the eleven S&P SPDR sectors was up for the week. Consumer Staples (XLP) and Communications Services (XLC) were the strongest, while Consumer Discretionary (XLY) and Real Estate (XLRE) were the weakest. The SPDR S&P 500 ETF Trust (SPY) was down -2.34 %.
5/6/22 – 5/13/22 S&P SPDR Sector ETFs Performance Summary
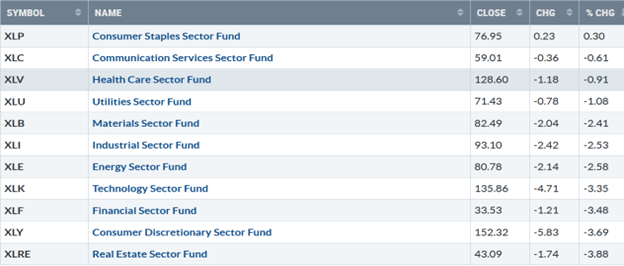
Source: Stockcharts.com
Figure 2: Bonnie's Mix of ETFs Performance Summary 5/6/22 – 5/13/22
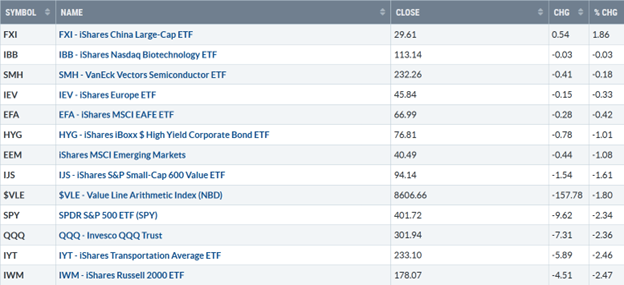
Source: Stockcharts.com
Small Cap Growth and Value and Technology were lower for the week on high intraday volatility that is likely to continue.
Market sentiment now shows extreme fear, with the CNBC Fear and Greed Index (a contrary indicator) closing at 12. The AAII Sentiment Survey (a contrary indicator) continues to show abnormally low optimism, and pessimism remains high above its historical average, implying a potential market bottom could occur sooner than most people believe.
Figure 3: UST 10 YR Bond Yields Daily
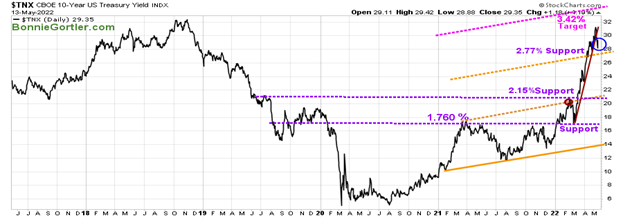
Source: Stockcharts.com
The Ten-Year US Treasury Yields (TNX) moved lower last week, closing at 2.935% breaking its steep uptrend (blue circle).
The upside target of 3.42% remains.
Support is at 2.77%.
Figure 4: UST 5 YR Bond Yields Daily
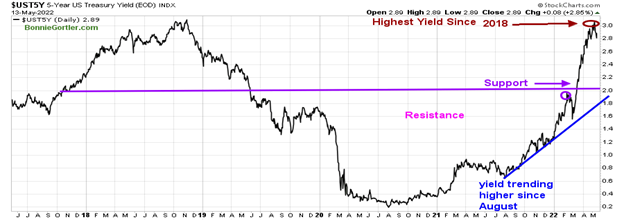
Source: Stockcharts.com
The Five-Year US Treasury yield dropped last week, closing at 2.89% (brown circle), down from its highest reading since 2018.
Despite Friday’s powerful rally with above 90% upside volume, the short and intermediate trend remains down. For the week, The Dow fell -2.14%. The S&P 500 was down -2.41%, and Nasdaq fell -2.80%, again the weakest averages. The Russell 2000 Index declined by -2.55%, while The Value Line Arithmetic Index (a mix of approximately 1700 stocks was down by -1.80%.
Weekly market breadth continued to be negative for New York Stock Exchange Index (NYSE) and Nasdaq. The NYSE had 868 advances and 2754 declines, with 42 new highs and 1727 new lows. There were 1207 advances and 4265 declines for the Nasdaq, with 82 new highs and 2734 new lows.
Until market breadth improves daily, it will remain challenging for consistent, sustainable gains from the long side. Market breadth remains concerning.
Figure 5: Daily Nasdaq Advance-Decline Line
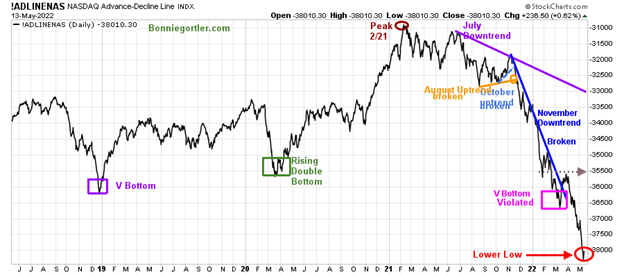
Source: Stockcharts.com
The daily Nasdaq advance-decline line peaked in February 2021 and continues to make lower lows. Risk management with a focus on Safety and Capital Preservation remains a priority.
For a major market bottom to occur, improved market breadth is needed, and the averages get through resistance above breaking the downtrends.
Keep a close eye for several days in a row of more advances than declines, with new lows contracting below 150 for the first sign of a potential sustainable intermediate rally.
Figure 6: CBOE Volatility Index VIX
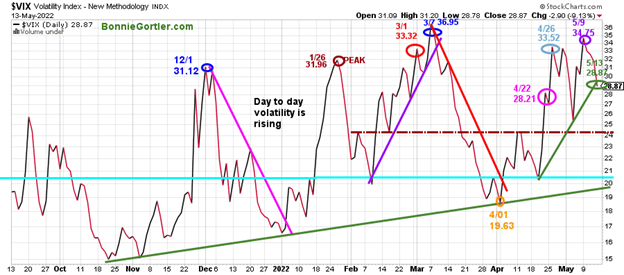
Source: Stockcharts.com
The CBOE Volatility Index (VIX), a measure of fear, has been trading above 20.00 for most of 2022. In January, VIX made a high at 31.96 on 1/26 (brown circle), on 3/1 at 33.32 (red circle), and 36.95 on 3/7 (blue circle). VIX remains below March and April peaks.
Last week, VIX rose to 34.75 on 5/9 (purple circle). However, VIX then retreated as the major averages held support and reversed. VIX finished the week at 28.87 (green circle). It’s a promising sign that the April uptrend could be broken on any rise early next week.
On the other hand, expect more day-to-day volatility until VIX closes at a minimum below 24.00 (brown dotted line) and ultimately falls below the 4/01 April low (orange circle) at 19.63, which may not occur until summer, when investors decide to take time away from the market.
If you are day trading, adjust your size of trades to be smaller and keep tight stops if the decline continues to accelerate lower to manage your risk. If you need support and are unsure how to navigate during these volatile times and would like to talk about your portfolio, schedule a free 30-minute strategy session by emailing me.
Even a small change in your portfolio can make a difference in your plan, helping you be more confident and comfortable on your journey to wealth.
Figure 7: Daily New York Stock Exchange (NYSE) New Lows
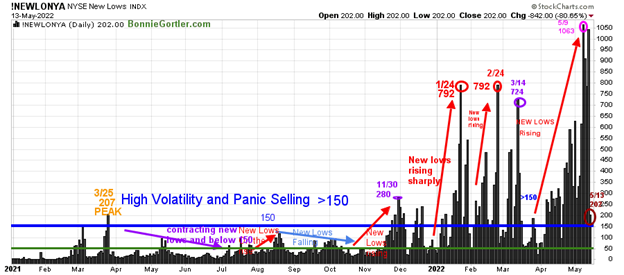
Source: Stockcharts.com
Watching new lows on the New York Stock Exchange is a simple technical tool that helps awareness of the immediate trend's direction.
New lows warned of a potential sharp pullback, high volatility, and "panic selling" for most of 2022, closing above 150. Learn more about the significance of new lows in my book, Journey to Wealth, published on Amazon.
Here is an excerpt: "When new lows are above 150, the market is negative, higher risk, and selling is taking place. Sometimes it could be severe, and sometimes on a very nasty day, you can have 'panic selling,' and big wild swings (high volatility) to the downside may occur."
As the market started to move lower in January, new lows rose sharply, peaking at 792 on 1/24 (red circle), and then contracted but not enough to be in a low-risk zone before rising again on 2/24 at 792, matching the 1/24 peak. In March, things were looking better as new lows fell below 150, and a rally began, but it was short-lived.
Early last week, the decline accelerated, and investors unloaded stocks. New lows increased, making a new high for 2022 of 1063 on 5/9 (pink circle). As the week progressed and the market began to stabilize, new lows contracted to 202 on 5/13 (brown circle). If last week's decline was extreme and a short-term bottom, then new lows are likely to drop quickly below 150 and then fall between 25 and 50. On the other hand, if the decline is not over, new lows will increase.
Figure 8: Daily iShares Russell 2000 (IWM) Price (Top) and 12-26-9 MACD (Middle) and Money Flow (Bottom)
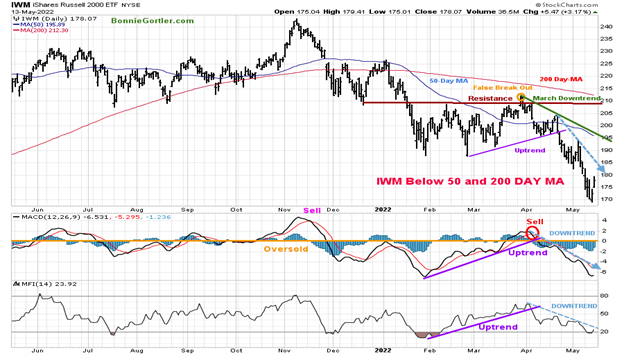
Source: Stockcharts.com.
The top portion of the chart is the daily iShares Russell 2000 Index ETF (IWM), the benchmark for small-cap stocks, with a 50-Day Moving Average (MA) (blue line) and 200-Day Moving Average (MA) that traders watch and use to define trends. IWM failed to break out above resistance at 210.00 (orange circle) and turned sharply lower, forming a downtrend (green line). Despite Friday's gains, IWM closed at 178.07 down -2.47%, remaining in a downtrend, closing below the 50 and 200-Day Moving Averages.
IWM reversed sharply intraday on Thursday after falling slightly below support at 170.00, closing near its highs on Friday up +3.17%. Short-term resistance is 185.00, 195.00, 200.00, and 210.00. Support is at 175.00, followed by 170.00 and 160.00. MACD (middle chart) remains on a sell, below zero, a slight turn up, yet still in a downtrend (dotted blue line) since April, implying the decline may not be over and a test of last week's lows could occur.
Money Flow (lower chart) turned up and is close to breaking the April downtrend (dotted blue line).
Figure 9: Daily iShares Russell 2000 (IWM) Price (Top) and 12-26-9 MACD (Bottom)
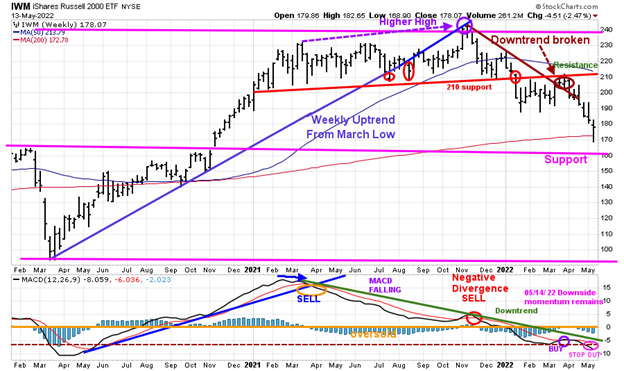
Source: Stockcharts.com
IWM for the intermediate term stalled under resistance at 210.00 after breaking the November downtrend and turned down. MACD (lower chart) is on a sell after a premature buy, followed by MACD making a lower low. MACD remains in a downtrend implying continued downside momentum.
Bottom fishing is risky until the MACD downtrend breaks, and IWM begins to show better relative strength than the S&P 500 (SPY). Nasdaq continued its short-term downtrend last week.
Figure 10: Daily Invesco QQQ Trust (QQQ) Price (Top) and 12-26-9 MACD (Bottom)
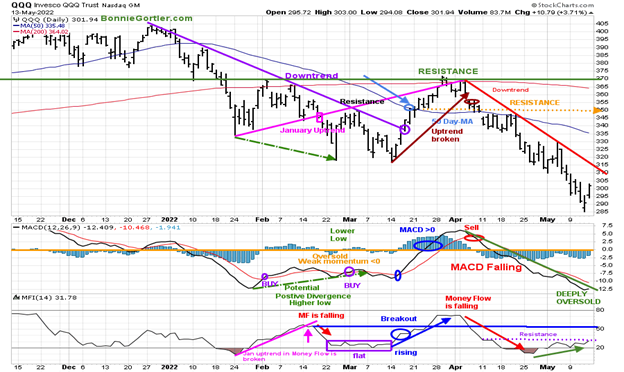
Source: Stockcharts.com
The chart shows the daily Invesco QQQ (QQQ), an exchange-traded fund based on the Nasdaq 100 Index with its 50 and 200-Day Moving Average. QQQ accelerated lower after breaking the January uptrend (pink rectangle), penetrating the January lows.
After breaking the March uptrend (brown line) at 355.00, QQQ has been under heavy selling pressure, and the short-term trend remains down (red line). Last week QQQ fell -2.36%, closing at 301.94, remaining below its 50-Day and 200-Day Moving Average, remaining under heavy selling pressure. Resistance is at 315.00, 325.00, 335.00, 350.00, followed by 370.00. Support is at 290.00, followed by 285.00.
The middle chart is MACD (12, 26, 9), a measure of momentum remains on a sell deeply oversold, below zero, and rising.
Money Flow (lower chart) trended lower in April but has recently begun to turn up from an oversold condition, closing under resistance (purple dotted line).
It would be a short-term positive for QQQ if MACD breaks the April downtrend and Money Flow closes above resistance. Note: QQQ (intermediate chart) is in a downtrend with MACD on a sell deeply oversold, below zero, falling, and below the March momentum low. Email me at Bonnie@BonnieGortler.com if you would like a copy of the chart.
Figure 11: Van Eck Semiconductors (SMH) Daily Price (Top), 12-26-9 MACD (Middle), and Money Flow (Bottom)
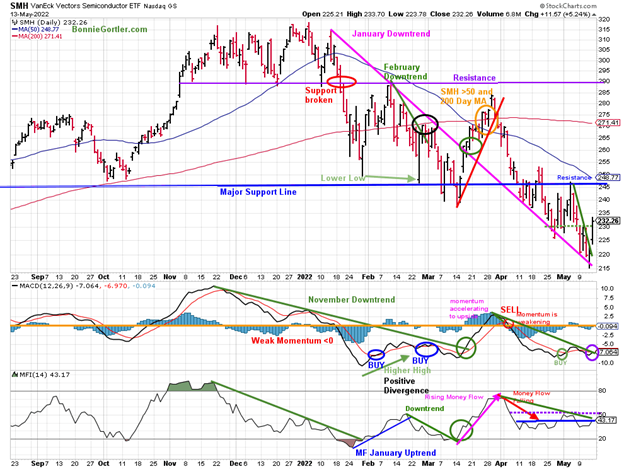
Stockcharts.com
In late January, Van Eck Semiconductors (SMH) support was broken (red circle) and then fell sharply but held the October 2021 lows. SMH then rallied but turned down again, closing below support at 240.00 on 3/14/22, a false breakdown. SMH broke the March uptrend (red line) after failing to get above the resistance at 290.00.
SMH fell -0.18% for the week, closing at 232.26, falling less than QQQ. It’s encouraging that SMH had a big up day on 5/13 +5.24%, breaking the May downtrend (green line). However, SMH still has work to do since it remains below its 50 and 200-Day Moving Averages.
Support is at 230.00, 223.00, and 220.00. Resistance remains at 245.00, followed by 255.00.
MACD (middle chart) is on a buy (green circle) and close to generating a re-buy (purple circle). However, MACD is not yet accelerating higher or above zero, showing internal strength. Watch to see if the downtrend breaks (green line) and then accelerates, which would signify strength in the sector.
Money Flow (lower chart) has been trending sideways since April 11 but broke out of its April consolidation, but then turned lower. Time will tell if Money Flow rises above the May highs (purple dotted line) and if it also can break the downtrend (green line).
Figure 12: Financial Select SPDR (XLF) (Top) and 12-26-9 MACD (Bottom)
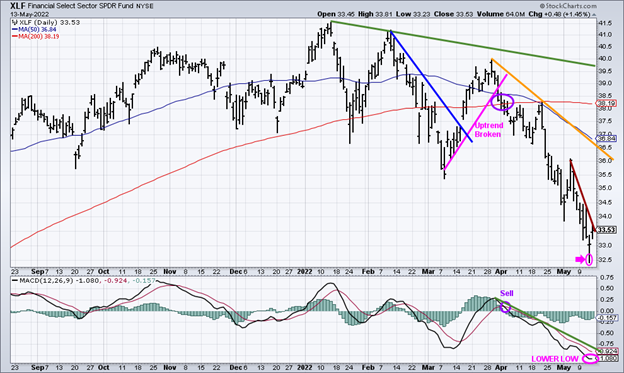
Source: Stockcharts.com
The 2022 downtrend in Financials (XLF) remains (green line). After breaking its March uptrend (pink line), XLF moved lower, followed by XLF breaking its March downtrend that failed at its 50 and 200 Day-MA (purple circle).
Financials (XLF) were down -3.48% last week as interest rates fell, continuing a pattern of lower lows and higher highs. However, XLF is now close to breaking its May downtrend if XLF shows strength early in the week.
MACD remains on a sell, below zero, and falling to a new low.
Until XLF closes above 34.50 and MACD turns up, the risk remains of further downside.
Summing Up:
A volatile week finished near the day's highs, squeezing some of the bears to cover shorts as some stocks rose more than 10%. The short-term trend remains down, with momentum patterns oversold but not yet favorable. Be alert to the averages continuing to advance if short-term downtrends are broken on an expansion of volume to the upside compared to downside volume. The short-term volume indicators I follow are oversold and in an area where potential favorable intermediate rallies are sustainable. For gains to be sustainable, Semiconductors, Technology, and Small caps need to lead the market higher by contracting new lows on the NYSE and Nasdaq. Improved market breadth is necessary for a major market bottom to occur, and the averages get through resistance above breaking the downtrends. Keep a close eye for several days in a row of more advances than declines, with new lows contracting below 150 for the first sign of a potential sustainable intermediate rally. Remember to manage your risk, and your wealth will grow.
Do you like charts? If you have any questions or comments or would like to talk about the market, I would love to hear from you. email me at Bonnie@Bonniegortler.com.
Disclaimer: Although the information is made with a sincere effort for accuracy, it is not guaranteed that the information provided is a statement of fact. Nor can we guarantee the results of following any of the recommendations made herein. Readers are encouraged to meet with their own advisors to consider the suitability of investments for their own particular situations and for determination of their own risk levels. Past performance does not guarantee any future results.


