

The S&P 500 (SPX) index plunged Friday after a report that the May Consumer Price Index jumped 8.6% on an annualized basis, states Jon Markman, editor of Strategic Advantage.
The rise was well above expectations, and it throws cold water on the idea the Federal Reserve will slow the pace of interest rate hikes any time soon. The benchmark responded by tumbling 2.9% to close at 3,900.
Bulls are in trouble. They lost support at 4,080 Thursday, and now bears are pressing forcefully toward critical support at 3,810, the 2022 lows. The odds are good bears will get there ahead of Wednesday’s Federal Open Market Committee meeting.
Inflation at the consumer level is still rising, and sentiment about the Fed is souring by the minute. There is simply no good reason for buyers to step in ahead of a test of the lows, a further decline of 2.3%. That said, the FOMC is potentially a game-changing event. And tests of important support levels bring reflexive buying. Be prepared for bears to partially unwind short position on any decline in the early part of the week to 3,810.
If that level fails on a closing basis, the next critical support level for the S&P 500 is 3,702.
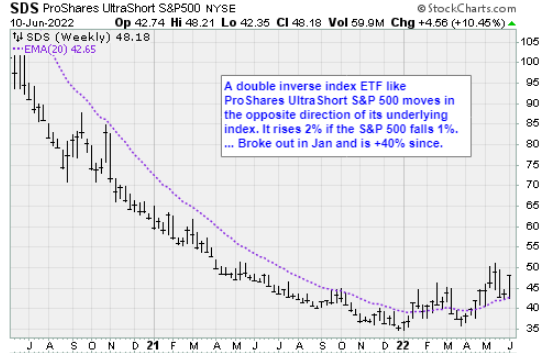
SA TradeView: We added the ProShares UltraShort S&P 500 (SDS) in a bulletin Friday at $48.00. Target is $50.90; stop is $44.55. We also added the ProShares UltraShort QQQ Trust (QID) at $25.20 in the bulletin. Target is $27.00; stop is $23.00.
The Upshot
The Dow (DJI) slid 2.7% to 31,392.79 and the Nasdaq (NDX) was 3.5% lower at 11,340.02. For the week, the Dow fell 4.6%, the S&P 500 retreated by 5.1% and the Nasdaq slumped 5.6%. All sectors sank, with consumer discretionary and technology posting the biggest losses. The US ten-year yield advanced 11.2 basis points to 3.15%. West Texas Intermediate crude oil futures dropped 0.8% to $120.55 per barrel.
Breadth favored decliners seven-one, and there were 24 new highs vs 826 new lows. Stocks on the super-thin list of new highs included nobodies like Permian Basin Royalty (PBT), Arcellx (ACLX), and the consumer price index soared 8.6% year on year in May, the most since December 1981, the Bureau of Labor Statistics reported Friday. The Econoday consensus was for an increase of 8.2% after prices climbed by 8.3% in April.
"The market is anxious to call a peak in inflation," but such optimism "appears to be unfounded, or at the very least premature," Stifel Nicolaus chief economist Lindsey Piegza said in a research note. Piegza sees a 50-basis-point interest rate increase in both June and July "with growing expectations" of additional half-point hikes should inflation remain hot.
On a monthly basis, the consumer price index increased 1% in May, according to the BLS, which said the increase was broad-based. The Street's view was for a 0.7% rise in May. Commerzbank Senior Economist Christoph Balz, who said the Fed "has been too late in tightening policy," projects 50 basis-point hikes at each of the next three rate-setting meetings.
In company news, DocuSign (DOCU) management underestimated macro pressures as it reported "disappointing" fiscal first-quarter results, while the electronic signature company's lower billings guidance points to an uncertain future for the remainder of the year, according to analysts. Shares of the company plunged 24.5%, the worst performer on the Nasdaq 100.
Illumina (ILMN) chief financial officer Sam Samad will leave the company on July eighth, the company said late Thursday. Chief strategy and corporate development officer Joydeep Goswami will also assume the interim CFO role as the company looks for a permanent replacement, it said. Shares dived 9% and were among the steepest decliners on the S&P 500.
Notes On My ScoreCard
Since the Covid-19 low was set in mid-March 2020, the average price of a gallon of gasoline in the United States has tripled. Since January 2021, the average price is up 122%. So far this year, the price is up 52%
Do you see a pattern? The pace is accelerating. That's a big problem as it shows all efforts taken to abate inflation have failed, and may even be making the problem worse.
Acceleration of inflation also makes it very hard for companies to plan effectively, which increases the likelihood of earnings estimate misses.
When you consider that the Federal Reserve has just started to raise rates to cool off the economy, you realize that any hopes that the central bank can back off on its tightening path are out the window. Count on the central bank to raise its target rate to at least 3.25% by the end of the year and quite possibly 4.00%.
As for stocks in the past week, phew! Monday and Tuesday were up nicely, and then our forecast that “all rallies will be sold” kicked in with 1%+ declines the next three days. Bespoke Investment Group analysts report that since 1945, there have been only 13 other similar instances, with the most recent happening in December 2018, otherwise known as the Christmas Eve Massacre.
The S&P 500’s forward performance on the first trading day of the new week in these 13 instances was mostly negative. A week later was a coin flip, but over the next one, three, six, and twelve months, performance was pretty impressive. In the December 2018 instance the S&P 500 was down on the following day, but after that recorded a gain of 2.9% the next week, 10.5% the next month, 18.1% the next three months, and 22% in the next six months.
One instance sticks out like a sore thumb, however: Oct. 16, 1987. The benchmark index crashed 20.5% the following Monday, and all periods from two weeks to one year forward were also negative. If we’re going to talk about the worst follow-on return we should also mention the best: The signal tripped very close to the end of the Great Financial Crisis bear market on Feb 27, 2009. The S&P 500 was down 4.8% on the following Monday and 7% over the next week. But after that investors cheered up and logged gains of 11% in a month, 21.5% in three months, 40.2% in six months, and 50.2% in a year.
Moving on…it’s worth noting that there was remarkable unity among asset classes, sectors, and stock factors. When you see such a tight correlation it means the market is responding to outside macro-economic forces and not the prospects for earnings growth for individual companies or groups.
The Dow Jones Industrial Average was the best single index, barely, with a 5.3% loss over the past three days. Most indexes fell around 6.2% in the three-day slam down. As for growth vs value, the S&P 500 Growth ETF (IVW) fell 7% while S&P 500 Value (IVE) fell 5.5%….Small-caps were no bargain, falling 5.5%.
The worst sectors over the past three days were Tech (XLK), -7.5%, and Financials (XLF) at -7.7%. The best were Energy (XLE) at -3.6% and Consumer Staples at -3.1%…even utilities were unplugged, down 5% as a group.
Overseas, the best country index over the past three days was China at -1%, followed by India (PIN) at -2.2%...the worst was Italy (EWI) at -9.1%.
Ags and metals were the best of the lot as Invesco DB Commodities (DBC) rose 0.1% over the past three days, and Gold (GLD) rose 1.%....Over in the mystical corner of the market, crypto land, Bitcoin (GBTC) was no help with a 7.6% loss, and Ethereum (ETHE) sank 11%.
Even government bonds were chewed up, with the 20-Year Treasuries ETF (TLT) down 1.2% in the three-day span. Still kind of hard to believe, but TLT is now down 20.6% for the year, providing no shelter from the storm.
Here’s a strange stat from Bespoke Investment Group: The performance gap between the best and worst sector ETFs this year is a stunning 90 percentage points: +64% for energy is best, while -26% for consumer discretionary is worst.
The kicker: In 1999, Tech’s 78% rally was 91 percentage points better than the 17% decline in Consumer Staples. The next year, it was Technology that was the worst-performing sector as its 41% decline underperformed the 50% gain in the Utilities sector. Plus can change…
If you’re feeling glum about stocks, you are in the majority. The Conference Board survey shows that just 28% of consumers expect higher stock prices, the lowest number since 2016. The survey shows just 9.3% expect a higher bond price. It’s rare for consumers to hate both stocks and bonds at the same time, and when it has happened before, it has been near stock price troughs. One year outperformance has been positive.
Consumer, labor, mortgage, and economic data are in the same boat: Reports are not super-negative yet, but the majority are falling steadily from their peak last year. There is a downturn in the offing, and it’s nowhere near the bottom at this time.…Stocks are falling ahead of the definitive data, as they are typically forward-looking…the good news is that the opposite will be true too sometime in the future: Stocks will rise well before the economic and consumer data does.
The Federal Reserve had already foreshadowed 50 bps hikes in June and July; the market is now sniffing out the possibility of the July hike turning into a 75 bps tightening. Make no mistake: From the perspective of the Fed, slowing the tightening process is a non-starter. A 75 bps hike probably won’t happen because Chair Jay Powell took it off the table a few weeks ago, but numerous serial 50-point increases are virtually certain. Ultimately expect a Fed Funds rate in the 4% area at minimum, which is a whole lot more than the 0% level the central bank adopted to help counter the pandemic recession.
But wait, there is a glimmer of hope that supply chain kinks that contributed to the ignition of inflation are getting worked out. Bespoke analysts note that the New York Fed’s Global Supply Chain Index aggregates a combination of existing supply chain metrics including the Baltic Dry Index, Harpex Index, air freight costs, and delivery time indices of PMI surveys into a single number to garner how stressed supply chains are globally taking into account both the reported time and cost of deliveries. It is measured in standard deviations based on how far from the historical norm these readings are. Bespoke reports that the index peaked at the end of last year and has generally been on the decline since then outside of a brief move higher in March and April that was largely reversed in May. The analysts conclude that the resumed decline in the index points to further improvements in supply chain stress, providing some evidence of inflation relief on the horizon as the index has held a modest correlation to year-over-year moves in both CPI and PPI since 1998.


