

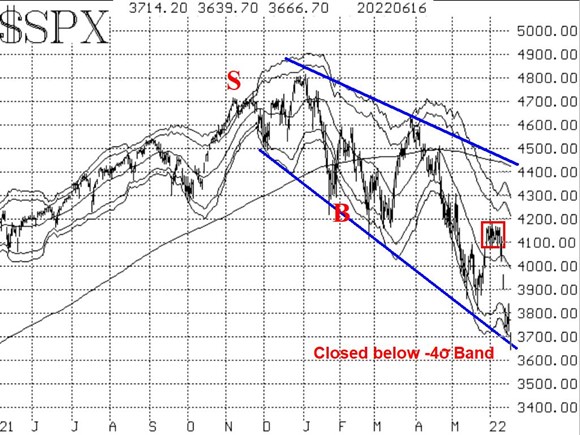
The oversold rally that took place in late May ran out of steam in early June, says Lawrence McMillan of Option Strategist.
The S&P 500 (SPX) then traded in a narrow range for several days (red box in Figure One). Once it broke out of that range—on the downside—a massive movement has followed. The decline has been severe, and $SPX broke to new yearly lows in the process. That reinforces the pattern of lower highs and lower lows on the $SPX chart. That is the only fact you need to know, to understand that this is a bear market.
An oversold rally is certainly possible, and it might carry as far as 4000+ on the upside, but that will not end the bear market.
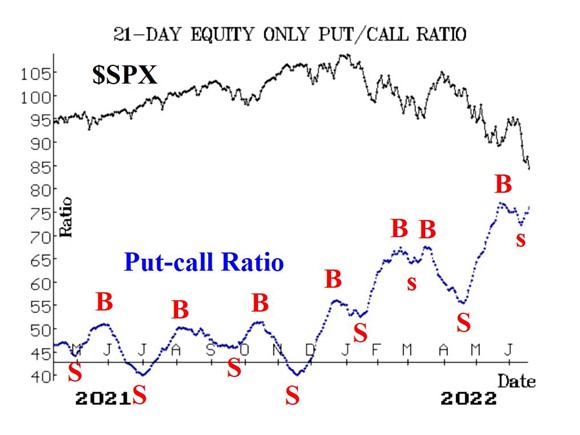
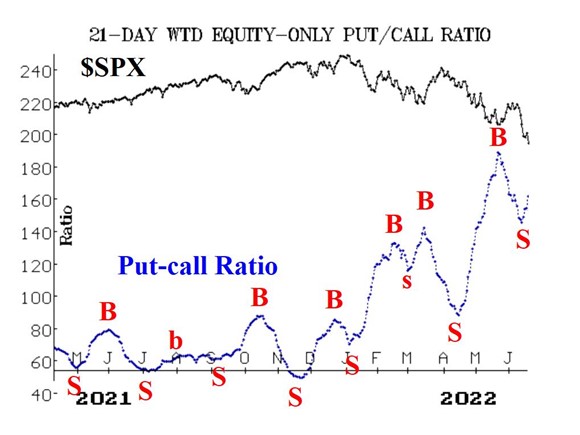
Equity-only put-call ratios have curled back upwards after the latest onslaught of put buying that accompanied the market decline this week. That has forced them to curl upwards, and to the naked eye that has moved them back to sell signals.
Market breadth has been abysmal. As a result, the breadth oscillators are on sell signals and are deeply oversold. But, "oversold does not mean buy"—a phrase which has kept you out of a lot of trouble so far this year (and has done so in severe market declines throughout history). It is going to take at least two or three days of strong advance-decline figures to generate buy signals from these oscillators.
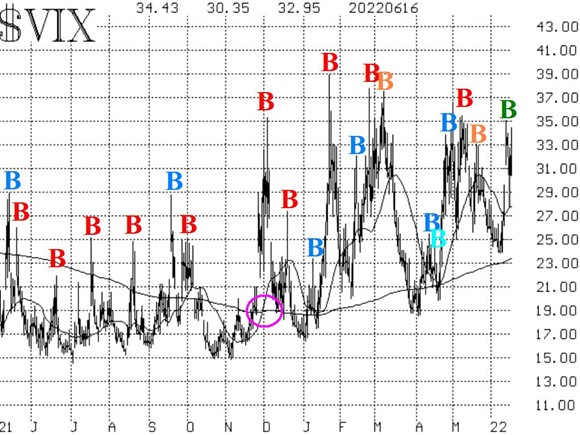
COBE Volatility Index (VIX) has still not responded much to the broad market decline. Even so, a $VIX "spike peak" buy signal was registered on June 15. However, the trend of $VIX remains upward, which is bearish for stocks. Specifically, the trend of $VIX is upward because both $VIX and its 20-day Moving Average are above the rising 200-day MA.
In summary, we retain a "core" bearish position and will trade confirmed oversold buy signals around that core position.


