Until proven otherwise, the current bounce, as delightful as it may be, still has the hallmark of a bear market rally, observes Joe Duarte, editor of In the Money Options.
On the other hand, it is certainly plausible that a tradeable bottom in stocks is being put in place. But in order for it to fully develop, real buying must come into stocks fairly quickly. Otherwise, the short-covering bounce will fade and we may head for at best another test of the bottom, or at worst a break to new lows.
The key, of course, is whether enough investors are convinced that the Fed is closer to ending its rate-hike cycle due to a rapidly decelerating economy and whether there are enough bargains in the stock market to warrant taking risks even if the Fed has one or two more rate hikes left in its quiver.
Interestingly, as I detail below in the NYAD section, there is some evidence that real buyers are coming into the market.
In the next section, I uncover what may be unfolding in the MELA system which could turn into a surprising set of events for the Federal Reserve, global governments, and those who rely on outdated, static data to make meaningful decisions.
MELA Adjusts as the Fed Focuses on Last Week
Central banks and economists make decisions on data from the past. It’s not their fault. It’s all they’ve got—sort of.
On the contrary, in the real world, things happen nearly instantaneously because of the interconnected nature of the MELA system and the willingness of the participants to act on the information as it happens.
Thus, it is MELA’s ability to respond rapidly to unfolding events that may give this rally some legs.
In other words, in MELA (the system composed of the Markets, the Economy, Life Decisions, and Artificial Intelligence), news travels fast and the system adjusts at what may seem to some to be the speed of light. Moreover, the system is bound by information and the reactions to that information from each system component as it travels through the interwoven matrix fueled by artificial intelligence.
Consider this: every time you buy something, a computer records the sale and an algo puts the data in some sort of data context based on the “if this happens, do this” principle.
That data then translates into trend analysis of sales, profits, and losses for businesses which are then pushed through decision-making algos which tell the CEO whether to expand or contract the business via instantaneous analysis of sales depth, geographical area, demographics, weather patterns, and who knows what else.
Eventually the algos in the stock, bond, currency, and commodity markets—program trading and market maker computers—react to news and money flows in fractions of milliseconds sending millions of dollars into and out of asset classes and moving markets instantaneously.
All of this data crunching and money movement eventually makes its way, via the expression of asset prices, to 401 (k) plans, IRAs, trading, and crypto accounts which in turn influence how much money anyone is willing to spend—from M to E to L via A.
Now you can see this clearly in the way the markets react to new data and how the public responds to what’s happening in the markets. When the stock market rallies, the economy soon follows.
For example, just last week, in this space, I noted that the housing market was in dire straits citing the following four bullets:
- Mortgage rates are exploding
- Housing starts are crashing
- Home sales are falling
- Realtors Compass and Redfin are cutting jobs
That was then. Except that in the month of May a surprising 10.2% increase in month-to-month new home sales materialized. Interestingly, the cause was twofold:
- Home prices initially fell due to higher mortgage rates and buyers pulling their horns
- The fall in prices led to a reassessment of the situation on the part of homebuyers
- Homebuyers decided to take the plunge in fear of mortgage rates going higher
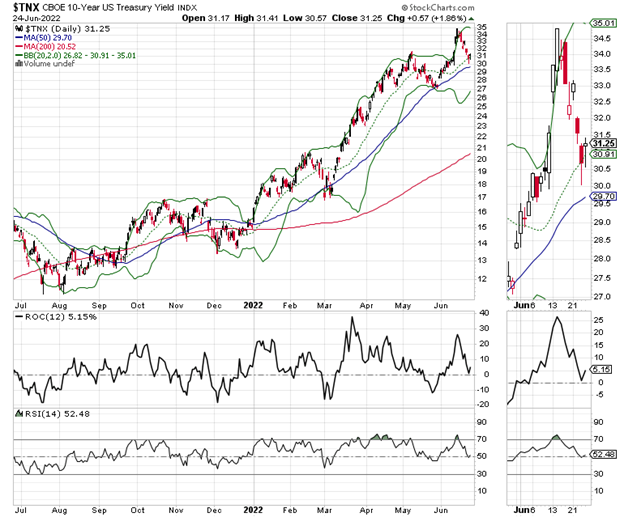
Now, nothing has changed in regard to those four items above. In fact, it was those four items that combined to make home prices fall which in turn pushed homebuyers off of the sidelines. Specifically, it was the decline in housing starts and home sales along with other signs that the economy is slowing that pushed the US Ten-Year Note yield (TNX) below its recent highs, which triggered a pullback in mortgage rates.

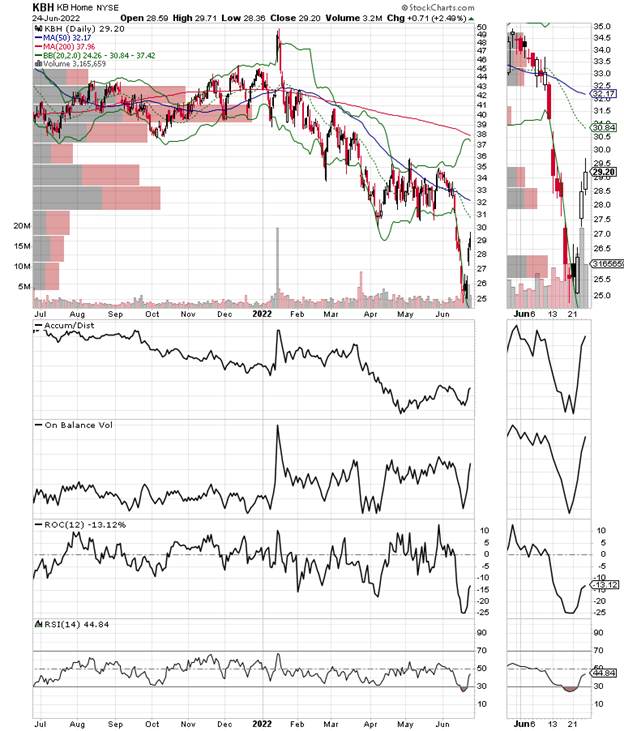
At the same time, the homebuilder sector, again spurred by the sudden retreat in mortgage rates and a strong earnings report from homebuilder KB Homes (KBH), delivered a bounce.

So, while the Fed is still talking about raising interest rates the system is already adjusting—as the algos must respond to their instructions based on the “if this happens, do this” principle and the system moves on.
But here is the kicker, as KBH and other homebuilders continue to note in their earnings reports, supply remains well behind demand.
Moreover, this has been the theme put forth by homebuilder after homebuilder over the past several quarters: business has dropped off but we’re still making money and expect to continue to make money because everyone is moving to the south and that’s where we’re building houses that are selling pretty well.
So, the Fed is still worried about yesterday’s inflation data when, in MELA, at least as it relates to housing, prices may have topped out and homebuyers are taking advantage of the situation as mortgage rates fall, even if only temporarily.
What’s my point? MELA is a rapidly adjusting system. Everyone except the Fed and the government is plugged in. Investors, consumers, and businesses are making decisions in real-time.
Moreover, the one thing that ties them all together is the rapid dissemination of news which causes equally rapid responses from artificial intelligence, which in turn affects behavior and leads the system toward a new level of operation.
Even more interesting is this thought. Can the system handle a central bank that is no longer just two steps behind reality as has been the norm, but is now decades behind the technology and analytical curve in its decision-making process?
NYAD and Options Market Review
This week I am offering two views of the related market internals. First, let’s look at the market’s breadth.
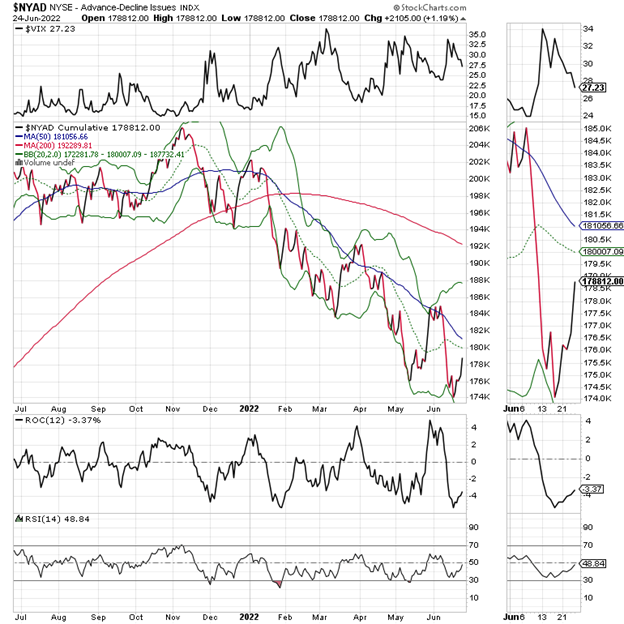
The NYAD Advance-Decline line (NYAD) recently made a new low and remains in a downtrend. If NYAD can climb back above its 20 and 50-day moving averages, however, the rally will have a much better chance of continuing.
Looking at the relationship between the CBOE Volatility Index (VIX) and NYAD, we see that once again they are in synch as VIX is falling and NYAD is rising. A rise in VIX means rising put option volume, a bearish development for stocks.
Moreover, the recent new low on NYAD was not confirmed by a new low on RSI. Usually, this is a bullish development. We’ll have to see if it holds up.

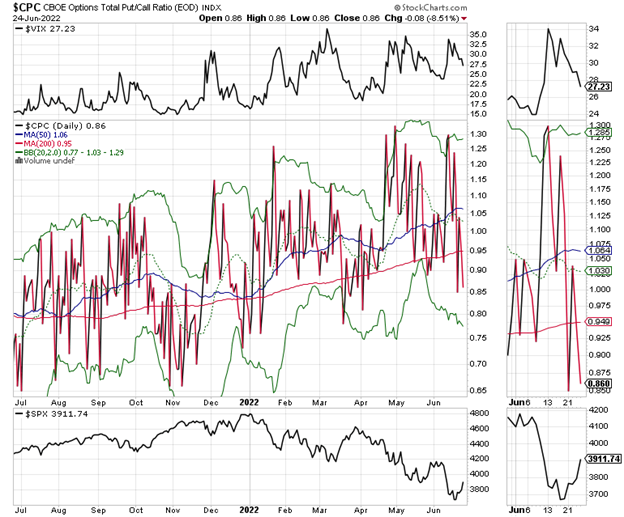
Now, if we look at VIX along with the Put/Call ratio (CPC) we see that these two indicators are also well synchronized.
This means that at the moment the volume of puts has been driven by put buyers. Put purchases, however, lead market makers to sell puts which they have to hedge by buying stock index futures in order to avoid losses.

So, for now, it looks as if the short covering was spurred by market makers hedging their put sales to put buyers.
The S&P 500 (SPX) remains in a bearish lower high, lower high downtrend trading pattern. If SPX can close above 3900-4000 convincingly, though, it could spur more buyers to come in. Very stiff resistance awaits at 4100 and above.
The Nasdaq 100 Index (NDX) is back above its 20-day moving average with overhead resistance at the 50-day and the 12500 area. On the bright side, both Accumulation Distribution (ADI) and On Balance Volume (OBV) turned nicely higher which means that there is some actual buying going on in tech. A further move above 12,000 could take us back to the 12750 (or so) area.
To learn more about Joe Duarte, please visit JoeDuarteintheMoneyOptions.com.


