

Bulls let a strong Friday escape their grasp, which was a bummer but not fatal, notes Jon Markman, editor of Strategic Advantage.
In our popular feature “Notes on my Scorecard,” you’ll learn something fascinating and heretical about trading volume and we’ll explain which sectors tend to fare best in the rebound following a steep decline.
Observation Deck: After a flat open on Friday the S&P 500 (SPX) jumped toward the July ninth gap at 4,017, where sellers emerged. The benchmark index finished at 3,962, a decline of 0.9%.
Technology stocks led the way lower following another poor financial report from Snap, Inc. (SNAP). Shares of the social media company have been under pressure since last October when TikTok, its Chinese rival, began gobbling up market share among 15- to 24-year-olds. The Snap news, coupled with the predicted stand-by bears at 4,017, was enough to snap a three-day winning streak for the S&P 500.
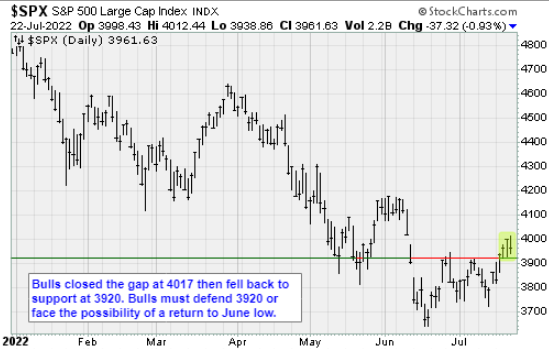
However, for the week the index added 2.6%. This is a tricky tape. Bulls have set up important support at 3,920, the 50-day moving average. Meanwhile, bears successfully answered the bells at 4,017, and the longer-term trend is still down.
Despite this, I suggest giving bulls the benefit of doubt early this week. I like that they easily recaptured the 50-day moving average last week, and short-term interest rates quietly peaked in June. The outline of a bullish reversal is taking shape. The bulls just need to hold 3,920.
SA TradeView: No current positions. We will be looking to buy a decline early in the week to 3,920. I will advise with an intraday update as appropriate.
The Backstory: The Dow (DJI) declined 0.4% to 31,899.29 on Friday, giving up earlier gains. The Nasdaq (IXIC) dropped 1.9% to 11,834.11. For the week, the major market indexes trimmed their gains after snapping a three-day rally, with the Dow ending 2% higher, the S&P 500 up 2.6%, and the Nasdaq rising 3.3%.
Utilities led the gainers while communication services ended 4.3% lower while technology fell 1.4%.
Breadth favored decliners three-one, and there were 106 new lows vs 40 new highs. The leaders were Genuine Parts (GPC), Booz Allen Hamilton (BAH), Service Corporation (SCI), Ryan Specialty Holdings (RYAN), and Acadia Healthcare (ACHC). That’s still not great leadership, but it shows how midcap and smallcap stocks are attracting the most attention in this transition zone.
The US ten-year yield slumped 15 basis points to 2.76%, with rates retreating across the term structure from three-month to 30-year securities. West Texas Intermediate futures fell 1.8% to $94.64 a barrel.
Social media stocks suffered Friday after Snap and Twitter (TWTR) swung to second-quarter adjusted losses. Snap and Pinterest (PINS) closed 39% and 13.5% lower, respectively, while Meta Platforms (META) and Alphabet (GOOGL) shares were down 7.6% and 5.8%, respectively.
Twitter managed to end the session 0.7% higher, reversing a morning decline, after the social media company reported Friday a surprise second-quarter net loss. Revenue fell 1% year-over-year to $1.18 billion, trailing the $1.34 billion analyst mean. The social media website said advertising headwinds and uncertainty surrounding a proposed buyout by Elon Musk hurt revenues.
In other economic news, state-level data from the Bureau of Labor Statistics showed that the unemployment rate fell in ten states in June, rose in two states, and held steady elsewhere. The largest decline was in Missouri, while Minnesota has the lowest jobless rate in the US at 1.8%, followed by Nebraska at 1.9%. The District of Columbia posted the highest unemployment rate in the US at 5.5%. The national unemployment rate held steady at 3.6% in June.
The flash manufacturing reading from S&P Global fell to 52.3 in July from 52.7 in June after regional data from the New York, and Philadelphia Federal Reserve banks were mixed.
In other corporate earnings news, HCA Healthcare (HCA) reported second-quarter earnings and sales that beat the market consensus. Its shares surged 11.4%, the top performer on the S&P 500.
Verizon Communications (VZ) slashed its full-year earnings outlook as customers pulled back on spending, while the firm posted a lower second-quarter profit that missed expectations. Shares slumped 6.7%, the worst performer on the Dow.
Notes on My Scorecard
If you can determine the Federal Reserve’s terminal interest rate, the date of the start of the next recession, the peak of inflation, and the end of the war in Ukraine, you can determine when stocks will sniff out recovery and rebound appropriately. Piece of cake, right?
I’ve been involved with markets for more than 35 years and I’ve seen a lot of things, including five bear markets and a variety of crashes. But I have never seen the Federal Reserve lift its interest rate target sharply when the US economy is as fragile as it is now. The Fed has got to do it to smush inflation, but don’t think the impact is easily predictable because it’s not.
The coming week is likely to be pretty wild as the biggest technology firms, which are over-weighted in the market indexes, will report second-quarter earnings and offer their forecasts for the rest of the year. Extreme pessimism is the dominant sentiment among investors large and small, so it’s fair to go contrarian and expect a neutral to a positive response.
Our favorite investment theme is the digital transformation of business and society, and that effort has continued in the background no matter how volatile stocks have been. Migration to the public cloud, the emergence of ubiquitous streaming media and online shopping, the electrification of the global vehicle fleet, the rush to protect assets with advanced cybersecurity software, the rise of advanced semiconductors in every part of modern life, the expansion of artificial intelligence solutions to improve customer experiences from sales to health care and the expanding dependence on mobile communications, have all relentlessly improved our lives and created fortunes.
Public investors have made zillions of dollars on these underlying trends while stocks were rising until the end of last year. This year, we have given some back and adopted a largely neutral stance on stocks. But make no mistake: Shares of tech companies and the customers they serve will be back in a big way sooner than you think. Maybe not this week or this month or this quarter, but sooner than professional bears and lay skeptics would have you think.
Tech bulls made a lot of progress in the past week, with ample breadth in their successful effort to push the SPDR Technology (XLK) over its 50-day average. XLK is still below its 200-day average and has a long way to go to right the ship, but it’s moving in the right direction.
The sentiment is so bad that it is good. Bears dominate in the survey of independent investors by AII and a Merrill Lynch manager survey showed that bulls were in the minority, which is rare.
Oddly enough, the most bullish entity in the markets today is the Fed. It is expected to lift interest rates by three-quarters of a percentage point this week even though its own GDPNow model forecasts a second straight print of negative GDP growth will be reported on Thursday.
A lot of conventional technical analysts have complained that the modest but firm advance this month has come on relatively low volume and therefore lacks conviction. But that view represents a total misunderstanding of the role of volume in advances, according to a study by Bespoke Investment Group.
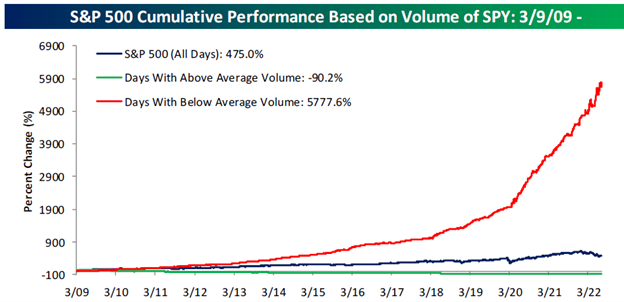
The chart above, created by Bespoke, shows the cumulative performance of SPDR S&P 500 (SPY) since March 2009 low and then breaks out those returns based on whether or not each day had above or below average volume. The analysts discovered that while the S&P 500 is up 475% from its March 2009 low, its cumulative performance on below-average volume days has been more than ten times that level at 5,777.6%. Conversely, the S&P 500's cumulative return on above-average volume days since March 2009 has been a decline of 90.2%! This is heresy but the data doesn’t lie.
The pattern has also been in full effect so far in 2022, Bespoke reports. Year to date through July 18, the S&P 500 was down over 18%, but the cumulative return on below-average volume days have been a gain of 22.0% compared to a cumulative loss of 33.5% on above-average volume days. Wow.
The analysts admit there is no way to actually trade on this trend as you don't know whether it's an above or below-average volume day until after the fact. But at the very least, their takeaway is this: The concept that a “durable” rally needs to be accompanied by strong volume could not be more wrong given what the historical data shows. In reality, the market advances on low volume and declines on high volume.
Before we get overly excited about the recent rebound, let’s take a second to note that 5% countertrend rallies in bear markets are very common. Here are three examples, using BI data....Dotcom bust: From its March 2000 pea to its ultimate low in October 2002, the S&P 500 lost 49% of its value but along the way the S&P 500 rallied 5%+ eleven times.…Financial crisis: From October 2007 to March 2009, the S&P 500 lost 57% of its value. Yet the S&P 500 experienced twelve rallies of at least 5%.…Pandemic: During the five-week Covid crash from mid-February through late-March 2020, the S&P 500 lost more than a third of its value, yet there were three rallies of at least 5%.
One more valuable note from the BI analysts: One consistent trend in the 5% rallies in bear markets since 2000 is that the sectors leading the way lower in the prior decline tend to perform the best on the way up. For each decline, BI ranked sectors from worst to best, then calculated their median performance in the following 5%+ countertrend rally. The analysts found that the worst performing sector on the way down had a median gain of 14% in the following 5%+ rally, which is easily the best of any other sector. Conversely, the three best-performing sectors during the declines tended to have the weakest median returns in the following rally. Good to know.
Okay, one helpful add-on to that idea. The BI analysts turned to sector performance during both 5% countertrend rallies and rallies that turned out to be final and long-lasting: The worst performing sector during the bear market experienced a median gain of 45.8% in the month after the bear market low, while the second worst performing sector on the way down experienced a median gain of 32.2%.…And conversely, the two weakest performing sectors in the first month of new bull markets were the two sectors that held up best during the bear market….So the big idea here is that bear market ‘false alarm’ rallies tend to be led by the weakest sectors on the way down, but they’re also the best performing sectors when the market does make its ultimate bottom.
Manufacturing data has been weak in the past few months, and it’s getting worse, led by home-building activity. We’ll probably see the important ISM Manufacturing PMI Index surprisingly weak when reported in early August. The only good news is that the soft conditions are causing prices paid sharply lower, which should feed into a lower inflation print in the next few months.
Leading and coincident indicators of economic activity are falling dramatically, which feeds into the idea that a recession is likely not far over the horizon.
As for labor data, well, more jobs have been created lately but average hourly earnings growth is not keeping up with inflation, which means workers are losing ground in aggregate. That’s one reason the famed GDPNow economic model at the Atlanta Fed is forecasting Q2 growth at -1.6%, which would be the second negative quarter in a row. That’s the popular definition of a recession, though in reality it’s much more complicated than that and the official call is typically made as much as six months later by a small panel called the National Bureau of Economic Research—a private, non-profit non-partisan organization.


