
On Wednesday, we looked at the support level which needed to hold for the S&P 500 (SPX) to go higher, writes Ian Murphy of MurphyTrading.com.
Despite the negative news flow the level held firm and the US equity market advanced, reminding us yet again to trade price action on the chart and not the fundamentals.
Click images to enlarge. Source: stockcharts.com
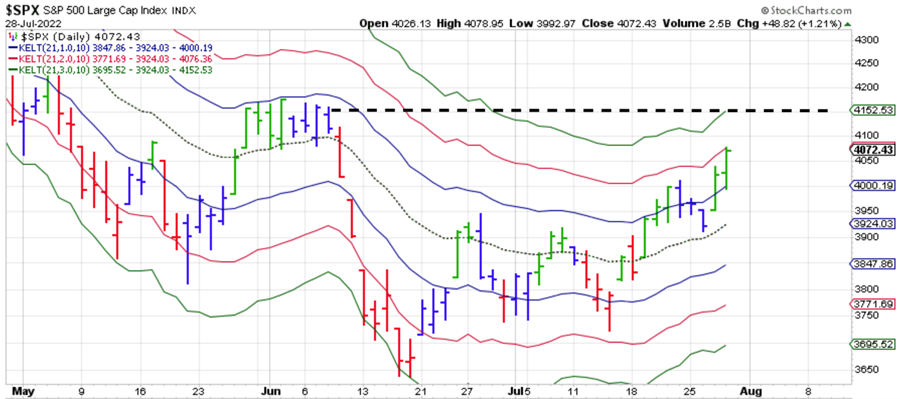
The next level of importance on a daily chart for the S&P 500 is where overhead horizontal resistance (dashed line) from the previous high overlaps with the 3ATR channel. That’s an area where the S&P 500 nearly always meets resistance and pulls back.
Click images to enlarge. Source: stockcharts.com
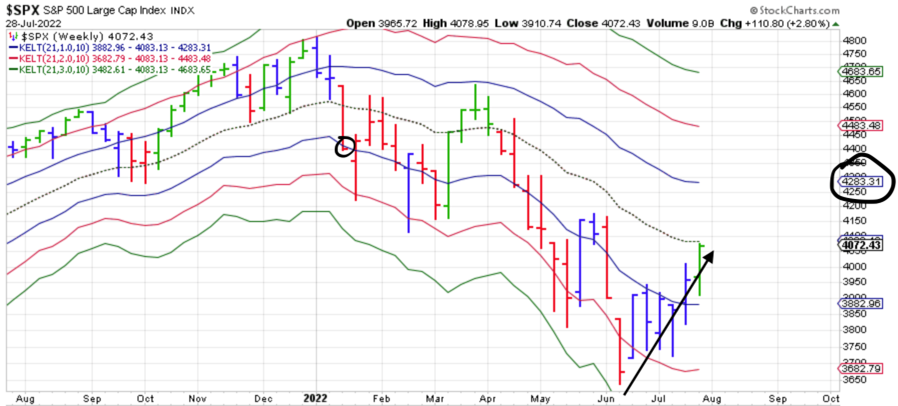
On a weekly chart, the S&P 500 has rallied 12% since the week ending June 17 (black arrow) and is now back in the middle of the neutral zone at the 21EMAC. The recent bounce is wonderful if you managed to get some good trades out of it, but technically we are still in the bearish trend which began in January (marked). The S&P 500 must get back above the 1ATR line on this weekly chart (4283) to exit that trend.
Until then, grab profits while they are on the table, but we shouldn’t overstay our welcome from the bulls.
Learn more about Ian Murphy at MurphyTrading.com.


