

There are two ways to measure stuff in the US, writes Ian Murphy of MurphyTrading.com.
The scientific and technical community prefers the international metric system, whereas regular folks like their pints, inches, and pounds. It comes as no surprise then that there are also two ways to measure a recession.
This time around the Republicans are going with the internationally recognized definition of two consecutive quarters of contracting GDP and have announced the arrival of ‘Biden’s Recession'. Meanwhile, the Democrats insist it’s not a recession because in America ‘The Business Cycle Dating Committee (not as exciting as it sounds) must announce a recession, and besides this time it’s different because the job market is strong.
Considering how politically relevant the ‘R-word’ will be ahead of mid-term elections, we can expect the rhetoric to ramp up significantly after the summer if the Dating Committee reaches a conclusion.
So how should we alter our trading and investing approach if an official US recession is announced? How will it impact the equity market?
As we know the stock market always precedes the economy because equity prices are based on expected future earnings, so the bear market in US equities which began on January 21 for technical types (June 17 for regular folk) has been front-running the recession debate for six months at this stage and will also recover many months before the economy does.
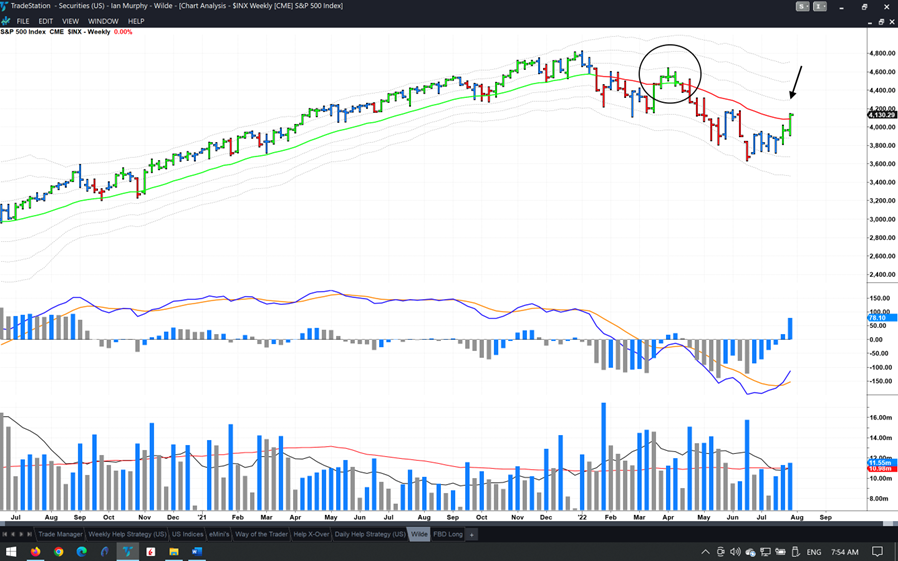
Click charts to enlarge
The S&P 500 (SPX) has risen 13% over the past six weeks and this has prompted some commentators to question if the market starting to bottom out and if a recovery is taking hold in stocks. The stock market and the economy have always been detached and the recent rally is impressive to be sure, but at this stage, it is no different from the previous bounce in April (circle) which ultimately failed.
I prefer to let the charts call bull and bear market cycles and looking at the chart above we are still in a strong bearish trend. Until such time as the S&P 500 gets back above the 1ATR line on a weekly chart (arrow) the current trend remains intact.
Weekly Trend Following
One of the stocks previously identified for this strategy is starting to look interesting again. If you recall, Vestas (VWSF) was originally added to the watchlist for fundamental reasons, namely the spike in oil and gas prices due to the war in Ukraine, and a renewed push to transition to alternative energy in Europe.
The entry was based on a technical pattern (MACDH divergence), plus the fact that the stock had halved in price between Jan 2021 to Jan 2022. I closed out the trade on the demonstration account when the soft trailing stop at the -1ATR line was breached as my style of trading and investing is notoriously cautious. However, some clients stayed in the original position and some reentered last week based on a classic price pattern.
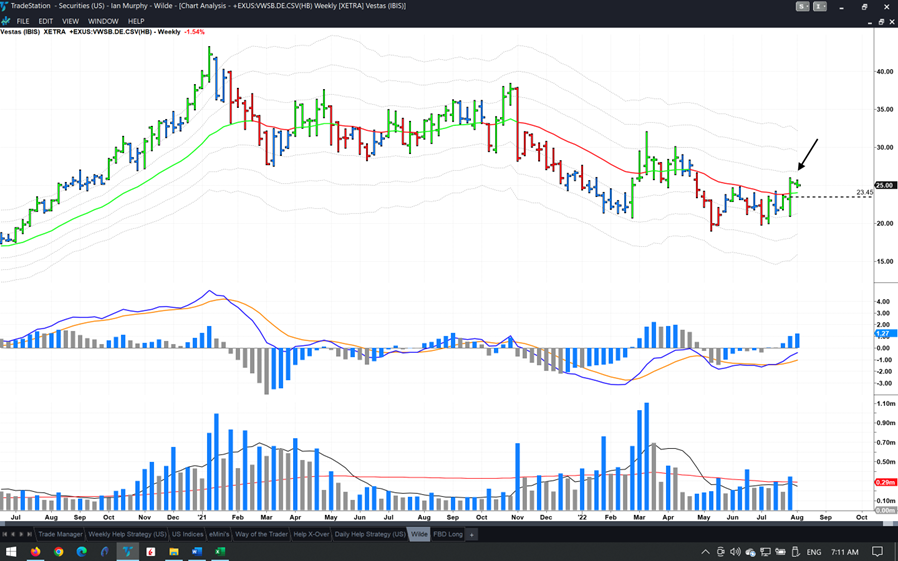
Click charts to enlarge
Last week on the Frankfurt exchange, Vestas washed out the previous two weeks' lows, reversed, and closed higher. It also found support on the -1ATR line on this weekly chart. A 50% retrace of last week’s bar (black dashed line) needs to hold as support this week if the stock is going to go higher. The stock has already started trading for the week and is slightly down so far this morning. Most importantly the price of Vestas needs to get back above the 1ATR line (arrow), something this Danish wind turbine manufacturer has failed to do all year.
Daily Help Strategy
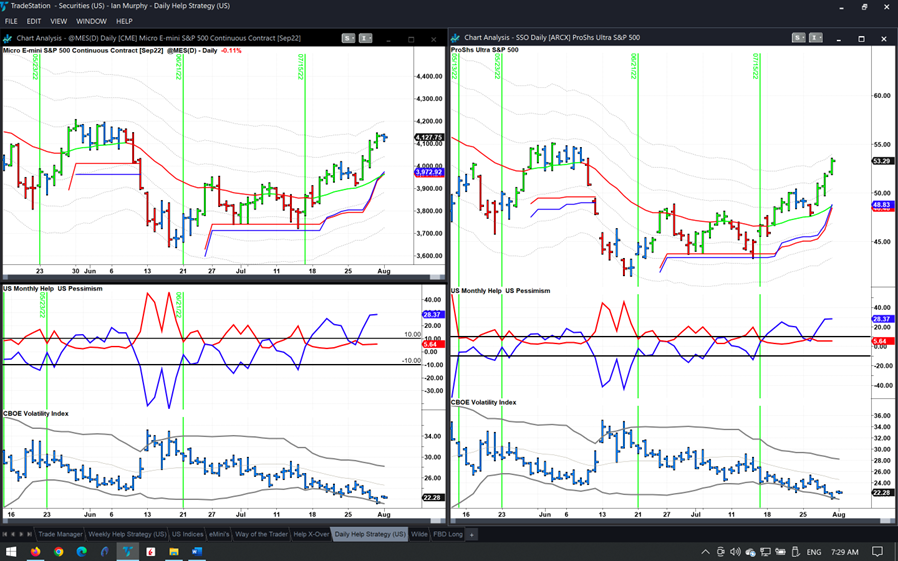
Click charts to enlarge
Based on Friday’s close the latest trigger on this one (#141) is up 14% on ProShares Ultra S&P500 2x Shares (SSO) (top right) since the entry on July 15, and 6.7% on Micro E-mini futures (MES=F) (left chart). Trading this strategy has not been without its challenges in the past few months, and the latest trigger is no exception. Let’s not forget we are in a bear market and this strategy is currently trying to catch bullish reaction rallies in a downward trend.
Not an easy task!
The bear market approach to the strategy (close out after a defined move to the EMA) would have seen you sit out the latest trigger, whereas the bull market approach (scale and trail) has turned out to be very lucrative on this occasion but generated small losses on the previous triggers.
Learn more about Ian Murphy at MurphyTrading.com.


