Stocks have been rising nearly unabated for two months, states Steve Reitmeister of Reitmeister Total Return.
A lot of that was because it was easy for stocks to "climb the wall of worry" created by the initial decline into bear market territory.
Meaning that it was fairly easy to find just enough silver linings or things not going as bad as advertised for stocks to bounce from that recent bottom. However, as we are finding out now...all good things must end.
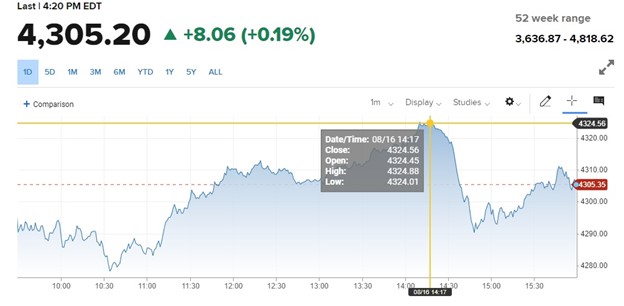
Investors finally found resistance at the 200-day moving average at 4,326 and retreated quickly from that mark to the finish line on Tuesday. Expect this level to denote the near-term highs for the market as we likely enter a consolidation period with a trading range to follow.
Why? And what are the parameters of this trading range? And what will cause us to break out of the range?
All that and more will be the focus of this week's Reitmeister Total Return commentary:
Market Commentary
Technically speaking...we are still in a bear market. That certainly is confusing to many investors given several weeks of upward price action. So let me spell it out for y’all.
The definition of a bull market is when you come out of a bear market and have risen 20% from the bottom. Well, the recent bottom is 3,636.87 and yet today we closed at 4,305.20 which is 18.38% above the lows.
It may sound like mincing words to keep calling it a bear market as it's pretty close to 20% above the lows. However, I think it's an important distinction at this moment to help set up a true battle for the soul of this stock market.
The bulls have indeed grabbed the upper hand over the last two months. But a lot of that was just “climbing the wall of worry” as the market days quite often. That being where sentiment is so bad that it only takes things coming in a notch worse than horrific to spark a rally. And once the rally is underway you get the FOMO part where folks are afraid of missing out on the upside potential.
It is one thing to say things are not truly that bad versus saying they are good enough to promote the full re-emergence of the bull market. That is why the 200-day moving at 4,326, also known as the long-term trend line, provides a very interesting battle ground for investors.
Check out the intraday chart from Tuesday below to see how stocks flirted with the 200-day moving average and then quickly reversed course:

It is my strong belief that there is not enough serious bullish sentiment to create a break above the 200-day moving average at this time. On the other hand, the bears have more to prove to make their case. This creates the perfect environment for a consolidation period and trading range.
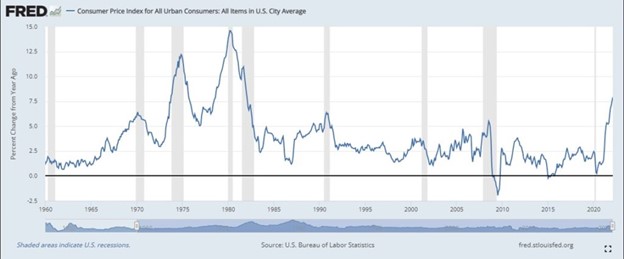
Yes, the relationship between high inflation and recessions/bear markets to follow is very strong as can be seen in the chart below:

However, until this starts showing up in a weakening of the employment market and/or earnings session for corporate America...then it is hard to make a serious case to push much lower. And thus the tug of war between bulls and bears should commence now.
The top of the range should be the 200-day moving average at 4,326 and the bottom of the range is likely the 100-day moving average at 4,100.
Reity, why do you continue to stubbornly call for a bear market when clearly other investors have spoken given the strength of the recent rally?
Because I have an economics background. And high inflation goes together with recessions and bear markets like peanut butter and jelly. It’s really just a matter of time as the chart above shows. So it may not have happened yet, but the problem still looms large.
Second, we have an inverted yield curve which is one of the most time-tested indicators of a looming recession and bear market. Why? Because bond investors are saying that they see a recession coming in the long term that is by its very nature deflationary. So rates will be lower in the future than they are now.
Third, the Fed is feeling a bit too good about the economy, which they take as a green light to raise rates like crazy in the coming months. Bond investors have already weighed on this notion with the inverted yield curve, which means they think the Fed will help generate a recession. Stock investors are likely to get the memo again once they see the damage appear in employment and/or corporate earnings.
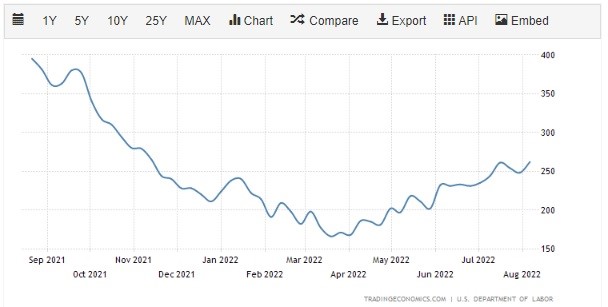
Fourth, the weekly jobless claims reports are the leading indicator of what will happen with monthly job gains. That has been going in the wrong direction since mid-March. Note that it is generally understood that once jobless claims get above 300,000 per week is when the unemployment rate starts to weaken. That wake-up call may not be that far in the future.

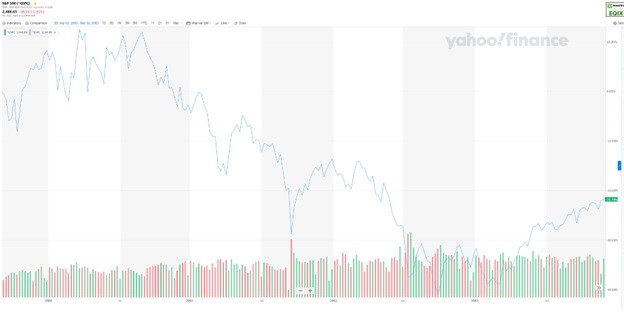
Fifth, this feels like the long-term bear market of 2000 to 2003 that started with the popping of a valuation bubble and later had to deal with a recession. That is why you will see in the chart below that it took about three years of drops, followed by seemingly impressive bounces and then more drops to finally find true and lasting lows in March 2003 before a healthy new bull market could emerge.

Will this bear truly last three years?
Maybe. Maybe not. But I am simply saying the battle is not over which is why I think stocks will stall out at these levels awaiting some clear catalyst for a convincing breakout in a bullish or bearish direction.
My money is clearly on it breaking bearish for the reasons stated. But indeed, I am open for the bullish premise to win the day. That is why our hedged strategy is the right one for the time being. That being equal allocations to inverse ETFs and long stock positions.
As stated in Monday’s trade alert:
“If we do break above the 200 moving average with gusto and there is more reason to be bullish, then we will start to sell our inverse ETFs and start adding more stocks. On the other side, if my thesis is correct that this is a long-term bear market and we start to retreat, then we will do the opposite. Which is to sell off the stocks and perhaps add more inverse ETFs. Proof of that would likely be falling back under 4,000."
Simply you can think of a hedge as the start of a tug of war with both sides equally matched. Whichever side starts pulling ahead...then we jump on the bandwagon to join the winning team.”
I think that last paragraph pretty much says it all and will leave it there for now.
Portfolio Update
|
TICKER |
DATE OPENED |
% ALLOCATION |
PURCHASE PRICE |
CURRENT PRICE |
CHANGE |
||
|
ACI |
8/15/2022 |
8.00% |
28.07 |
28.69 |
2.21% |
||
|
PPC |
8/15/2022 |
8.00% |
30.07 |
30.56 |
1.63% |
||
|
JBL |
8/15/2022 |
8.00% |
62.16 |
62.89 |
1.18% |
||
|
ICL |
8/15/2022 |
7.50% |
10.05 |
10.13 |
0.80% |
||
|
PSQ |
8/15/2022 |
13.00% |
12.12 |
12.08 |
-0.33% |
||
|
STM |
8/15/2022 |
7.50% |
38.47 |
38.26 |
-0.55% |
||
|
RWM |
8/15/2022 |
13.00% |
22.00 |
21.87 |
-0.57% |
||
|
SH |
8/15/2022 |
13.00% |
14.56 |
14.46 |
-0.69% |
||
|
RISR |
4/4/2022 |
7.00% |
30.15 |
29.23 |
-3.04% |
||
|
SJB |
6/15/2022 |
15.00% |
19.43 |
18.33 |
-5.66% |
||
|
TOTAL ALLOC. |
% CASH |
||||||
|
100.00% |
0.00% |
||||||
Today we got to see the hedge in action producing a +0.31% return. Yes, that topped the return of the S&P 500 (SPX). And certainly was far better than the 0% return we would have received if we stayed in cash.
One day does not make a trend...but it is nice to see something in this crazy world work out according to plan. That being where our five stocks packed with the full goodness of the POWR Ratings should outperform the average stock we shorted in our three inverse ETFs.
Yes, some of you think we should be gung-ho bullish at this moment.
Indeed I understand that feeling, given how stocks have been pushing higher nearly on a daily basis during this recent bull run. That is why I wrote today’s commentary as I did for you to appreciate what has happened to date...why we likely top out now...and what will be the catalyst to make the final bull/bear call in the end...and what we will do about it emerging from our hedge.
Closing Comments
Our plan is set. Now let the chips fall where they may and we will act accordingly.


