

Stocks tripped and skidded at the end of last week, but so far there are just flesh wounds, notes Jon Markman, editor of Strategic Advantage.
In our weekend notes, you’ll learn something remarkable about Apple (AAPL) momentum—and where strength is hiding in plain slight.
Strategic Insight: Bears needed a big, noisy decline on Friday, and that is exactly what they got. The S&P 500 (SPX) started weaker and closed near the low at 4,228, a decline of 1.3%.
The loss snapped a four-week winning streak for bulls. The selling also gave bears a platform to talk about typical bear market rallies, deteriorating macroeconomics, and excessive share prices.
Make no mistake: It’s all noise. The current weakness looks like a normal pullback in a bullish phase. The key is sentiment. Stocks are still rallying on bad news. Executives at Deere (DE) on Friday cut the financial outlook for the rest of 2022. Shares opened 4% lower, yet finished higher despite the broad market weakness. The reversal has the earmarks of professional money managers adding risk.
And while the decline Friday was clamorous, keep in mind that the benchmark S&P 500 rallied 18.8% from the June lows to the test last week of the overhead resistance at 4,325, also the 200-day moving average. A pullback was expected.
More importantly, pros are still buying dips. I expect them to step up those purchases on a decline for the S&P 500 toward the first support level at 4,175. This is the long game.
Strategic Trade: Toward the end of last week, we closed a short-term Strategic Trade in a double-leveraged Nasdaq fund for a quick 2.5% gain, which was sweet. We contemplated adding a leveraged short position Friday as the tape accelerated lower—yet we ultimately chose to remain on the sidelines. The goal is not to take every trade. We aim only to initiate transactions for which the probability of profit is extremely high. We will send an intraday update on Monday if warranted.
The Backstory: US stocks closed lower Friday as comments from St. Louis Federal Reserve President James Bullard about another big rate increase left investors concerned.
The Dow Jones Industrial Average (DJI) dropped 0.9%, the S&P 500 fell 1.3% and the Nasdaq (IXIC) fell 2%. For the week, the S&P 500 was 1.2% lower, the Dow fell 0.2% and the Nasdaq dropped 2.6%.
Consumer discretionary and financials were the steepest sector decliners Friday while healthcare and energy were the only gainers. Decliners outpaced advancers, two-one. Mega caps at the top of the new high list were Equinor (EQNR), Cigna (CI), Southern Corp (SO), Humana (HUM), Hershey (HSY), General Mills (GIS), Kellogg (K), and Booz Allen (BAH). That’s energy, health care, breakfast cereal, and a utility. This vanguard is not ideal, as health care and consumer product makers only lead when the mood is turning sour.
In monetary news, Federal Reserve Bank of St. Louis President James Bullard said he is open to another 50- or 75-basis point rate hike in September. "We should continue to move expeditiously to a level of the policy rate that will put significant downward pressure on inflation," and "I don't really see why you want to drag out interest rate increases into next year," Bullard was cited as saying. Since traders have been warming to the idea that massive rate hikes were on the back burner, this was a bit of a shocker. Just remember the Fed likes to play mind games to cover its tracks, so don’t overweight the comments from a single central bank official.
In other economic news, new data showed online retail sales rose by 2.7% in Q2 compared with a 1.9% gain in overall retail sales, lifting the online share of overall sales to 14.5% from 14.3%. Online sales were up 6.8% year over year, compared with a 7.2% gain in overall sales over the same period. That argues for an economic slowdown, but it’s far from a recession print.
In company news, Occidental Petroleum (OXY) shares rose nearly 10% Friday after a federal agency approved Berkshire Hathaway's plan to acquire as much as a 50% stake in the oil and chemicals producer. Apparently, the Oracle of Omaha is not worried about the future of carbon.
Notes on My Scorecard
One of my data junkie colleagues reports that the Nasdaq 100 (NDX) is always down around 5% one week after it was down more than 9% in the past 70 days, and up at least 8% in the past four weeks; and in the most recent week it was down more than 1.5% on Friday. There are actually four instances of this combination since 2000. The three most recent occurred on January ninth, 2009; January 30, 2002; and January second, 2001. Those prior instances occurred near the middle of the dot-com bear market and two months before the end of the great financial crisis bear market, which are scary analogs.
These types of analyses aren’t always right but it’s good to know the psychological backdrop, which in this case means that when the tech-heavy index performs well for a month within a larger decline, it usually tips over again soon.
The rally since June 16 has featured super-strong 15%+ gains in the major market indexes and 20% gains in high-beta sectors Consumer Discretionary (XLY) and Tech (XLK). Yet the S&P 500 is still down 10% this year while the Nasdaq is still down 20% YTD. Overseas indexes have perked up as well, led by Israel (EIS) and Brazil (EWZ). Laggards include Germany (EWG) and China (ASHR).
Of all factor and sector funds, the strongest have been S&P 500 Growth (IVW), +20.7%, and Consumer Disc up 25% since June 16.…Different category but in crypto-land, the Etherium Trust (ETHE) is +57% since mid-June (but still in a nasty downtrend overall, off 63% since December first).
One piece of the puzzle that doesn’t get mentioned enough is the recent uncoupling of stocks and bonds. Since August first, the S&P 500 is up 2.55% while the Ten-Year Treasury ETF (IEF) is down 2.5%. which weighs heavily on the classic 60/40 retirement funds ratio used by financial planners. Bonds are supposed to smooth out the ride for retirees and they are doing the opposite. This leads to a “negative wealth effect” which is showing up in weaker retail and confidence numbers.
Last week I published a chart that showed how the S&P 500 had stopped dead in its tracks at its 200-day moving average. The 200 ma also coincided with the May top, just before the benchmark stock index plunged for three weeks. This pullback is certainly not a positive, but the bulls will point out that it’s normal to see downside mean reversion after such a strong run. Before getting too worried, let’s wait to see how the index trades if it pulls back to the middle of its Keltner channel, which has repeatedly provided support and resistance this year. The level now is 4,163. The index could collapse toward that level but it could also crab-walk sideways and lower toward that level while just methodically working off the recent overbought condition.
Mega cap tech has been the star of the show since the June 16 low, led by a 32.7% gain in Apple (AAPL), a 38.7% gain in Tesla (TSLA), a 34% gain in Amazon (AMZN), and a 17% gain in Microsoft (MSFT). All of these are still down since the start of the year, with the worst being Amazon at -14%…and giant chip maker Nvidia (NVDA) at 36%.
Bespoke Investment Group analysts point out that the five largest stocks in the S&P 500 have added more than $1.8 trillion in market cap since 6/16. That’s a third of the total rise in market cap of $5.4 trillion off the lows, which is a great lesson: This market is not all about finding amazing small caps; it’s about shifting cash into the mega caps in times of trouble.
Costco (COST) has returned to juggernaut status. It’s +23% since June 16 and is down just -0.6% since the start of the year.…The best big caps in both time categories are UnitedHealth (UNH) at +9.3% YTD and +20% since June 16; ExxonMobil (XOM) at +59% and +4%; Eli Lilly (LLY) at +16%, and +12%; and Coca-Cola (KO) at +12% and +10.5%.…Keep all of these at the top of your radar as they will likely be the leaders of the next advance.
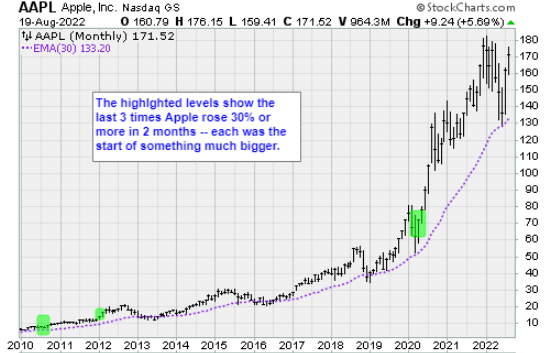
There’s been a lot of complaints among analysts that Apple has shot up to far too fast in the past two months and is due for a hard slap-down. …But Bespoke data doesn’t support the complaints. The researchers studied two-month rallies of 30% or more for Apple through its history to determine what typically came next. The answer: Stunning gains of 8.2%, 24%, and 35% over the next one, three, and six months! The most recent signals were May 19, 2020; Feb 14, 2012; and April 22, 20210...six-month gains for these were +15.4%, +24.9% and 50.7%…and the only three-month loss for the instances was -2.4% for the April 22 signal. That’s impressive.
Strategic Portfolio
Our spambot/email woes appear to be nearing a conclusion; cross your fingers. With any luck, we can return to on-time newsletter delivery in the next week or so.
Repeat: In the meantime, be sure to enter your cell phone number on your Account Settings page so you receive a text message containing a link to our latest letter when it publishes on our website. This approach bypasses the email system.
Daily Results: Our Digital Transformation list fell 1.4% on Friday. … We added Netflix (NFLX) shares back into our list at $208.17 on July 20 … We will have more recommendations soon.
Our Other Letters: In our Tactical Options letter last week, we sold Walmart (WMT) Sept $140 calls for a gain of 48.5% after an overnight hold.….In our Counterpoint Options newsletter, we sold our August fifth and August eighth positions in S&P Biotech SPDR (XBI) August $85 calls for an overall gain of 60% today, which was awesome.


