

Traditionally the summer doldrums in financial markets end with the Labor Day holiday in the US, which falls next Monday, September fifth, writes Ian Murphy of MurphyTrading.com.
However, Jerome Powell of the Federal Reserve couldn’t wait that long, and his no-nonsense speech at Jackson Hole last Friday brought an abrupt end to the seasonal slumber.
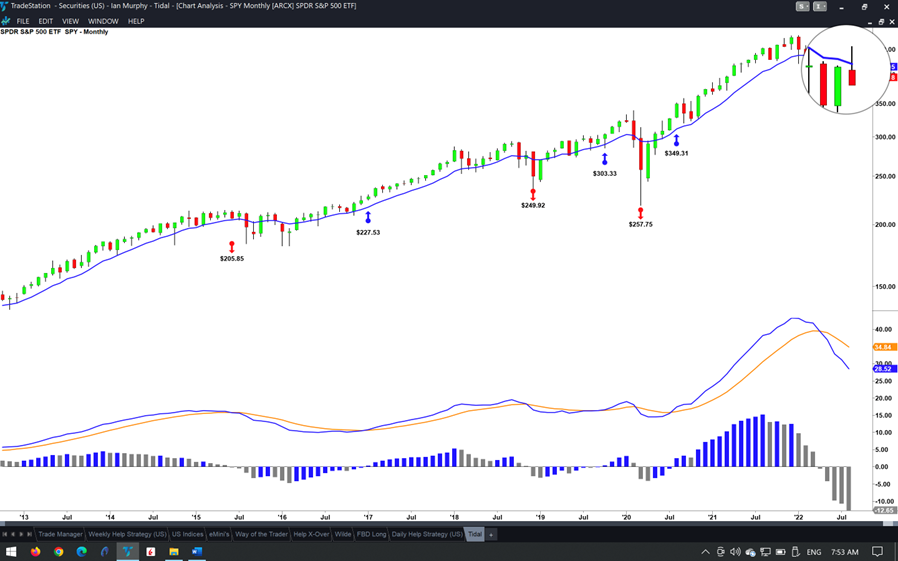
The heavy blue line on the chart below is a ten-period Exponential Moving Average calculated from the closing price at the end of each month (10EMAC). When the S&P 500 (SPX) (or in this case the SPX ETF (SPY) which tracks it) is trading above the line, it’s a bull market. Below the line, it is bearish.
In recent years regular pullbacks below the line were common, but the market always recovered and got back above the line after the nervous and weak hands had been flushed out.
Click charts to enlarge
However, the price candle for August (magnified) reveals a failed recovery. The bounce in stock prices during the month made headlines and prompted some commentators to question if the bear market was over. It even produced some tidy profits for short-term traders (see below), but when we look at a long-term chart, we can see the S&P 500 failed to close above the line, and the bearish trend which began in April on a monthly chart remains intact.
One of the secrets of successful trading and investing is to know the game we are playing. If you are employing a long-term monthly trend-following strategy such as the Tidal Strategy shown on this chart, you should still be in cash since the exit on April 29 and not have been tempted to reenter during the summer bounce.
Weekly Trend Following (WTF)
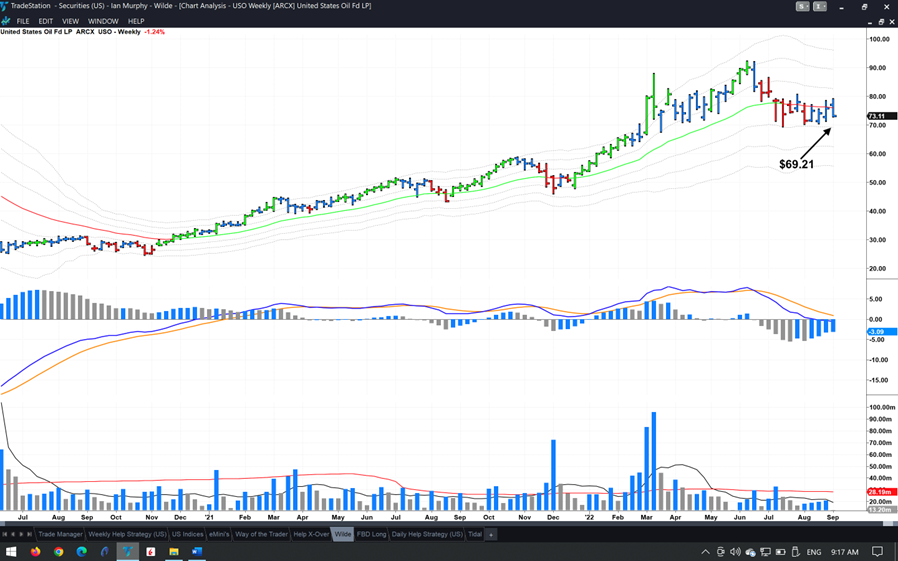
Oil is never out of the news these days and an update on the United States Oil Fund ETF (USO) was sent out on August 16. The -1ATR line on a weekly chart was identified as the point at which we should exit a position in this ETF if the price closed below the line.
Click charts to enlarge
Three more bars have appeared on the chart since then, and nothing has changed. Oil continues to trend sideways in the neutral zone and a close below $69.21 tomorrow will be the current signal to get out.
I know it can be frustrating to spend months in a position and watch the price go nowhere, but that’s the game we play with the WTF Strategy. At some point in September, this ticker could pop to the upside as it did last December, or it could break the line and kick us out, or it could just keep drifting aimlessly to the right. But we have to stick with it because the battle between oil bulls and bears is playing out in the background and we can only be on the side of the winner if we are in the game.
Daily Help Strategy
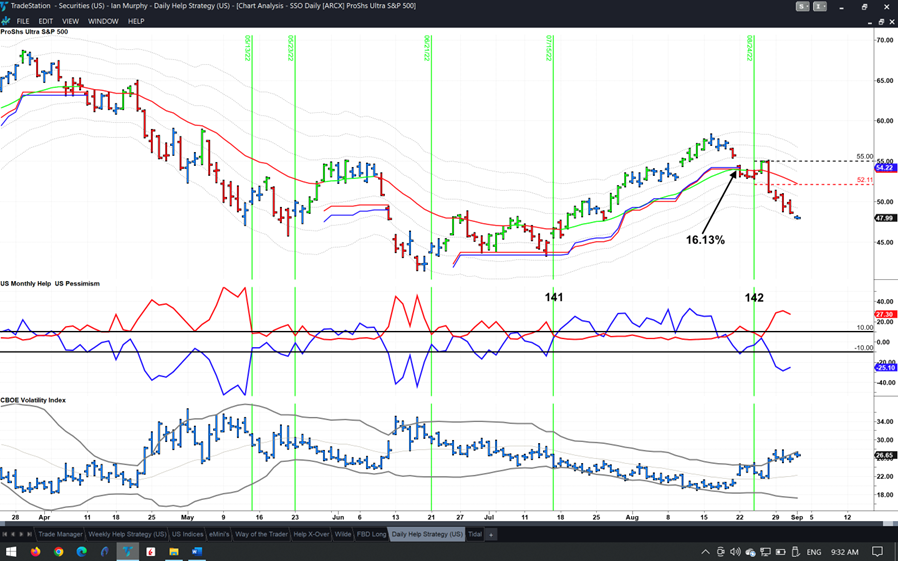
Trigger 141 on this strategy was mentioned in last month’s newsletter and it eventually ran out of steam and pulled back to the trailing protective stop on August 22, but not before producing an attractive 16.13% gain on ProShares Ultra S&P 500 2x Shares (SSO) (black arrow).
Click charts to enlarge
Another trigger occurred just two days later, and it managed to establish enough upside momentum to reach the first target at $55 (black dashed line) before sharply reversing course and hitting the initial protective stop at $52.11 (red line). Depending on how this trigger was managed, it was either a breakeven trade or it produced a small profit. Now we wait for number 143.
Learn more about Ian Murphy at MurphyTrading.com.


