

Bulls faded again after a strong start and appear to be headed for a test of the June lows as central bankers apply pressure on demand to reduce inflation, notes Jon Markman, editor of Strategic Advantage.
Our trade algorithm had a good day.…In the notes section, learn what happens when the S&P 500 (SPX) spends more than a hundred days under its 200-day average.
Insight
Trade on Friday played out exactly as predicted. Bulls sent the S&P 500 all the way back up to the 4,018, the 50-day moving average. Bears reloaded short positions there, and it was all downhill. The benchmark index closed at 3,924, a loss of 1.1%.There are no coincidences. Bears were always going to reload at the 50-day moving average. They won that level earlier in the week. And bulls were always going to retreat to 3,920, the minor support level I wrote about last week.
What happens next is less certain. The benchmark is now deeply oversold and sentiment is overwhelmingly bearish.
Traders are worried about an overzealous Federal Reserve and the growing prospect of a serious recession. They also fully expect that the S&P 500 will soon decline to test 3,640, the June lows.
It is hard to argue with that view given downside momentum. We would definitely short rallies, however, we are not inclined to get more short until there is a close below 3,920.
Trade
We are long the ProShares Ultra Short S&P 500 (SDS) from $44.29. The SDS closed at $46.05, up 2.1%...target to sell all is $51.90 lmt gtc. Adjust stop to new $42.45 stp.Backstory
The Dow Jones Industrial Average (DJI) slid 1.1% to 31,318 Friday and the Nasdaq (IXIC) fell 1.3% to 11,630. For the week, the Dow was 3% lower, the S&P was down 3.3%, and Nasdaq Composite dropped 4.2%. Make no mistake, these are serious chunks of change. Mr. Market is not messing around.All three indices were higher earlier in the session. Energy was the sole sector gainer, while communications services was the steepest decliner.
Breadth favored decliners five-three, and there were 308 new lows vs 36 new highs. Leaders were Constellation Energy (CEG), Cardinal Health (CAH), The AES Corporation (AES), and First Solar (FSLR). Utilities, solar energy, and health care—basically, a very defensive vanguard.
The US two-year yield dived 12.9 basis points to 3.39% and the ten-year rate dropped 7.2 basis points to 3.19%, which is still high.
Nonfarm payrolls rose by 315,000, beating the 298,000 increase expected, while July saw a downward revision to a 526,000 increase. The unemployment rate rose to 3.7% from 3.5%, compared with calls for the rate to remain unchanged, while the participation rate increased to 62.4% from 62.1%. Hourly earnings rose 0.3%, slower than the 0.4% gain anticipated.
"The solid increase in jobs and the uptick in the unemployment rate together keep the September Federal Reserve meeting decision in the balance," Morgan Stanley chief US economist Ellen Zentner said in a note, adding that consumer price data due September 13 "will be key in determining the Fed's decision."
The market probability of a 75-basis-point increase eased to 56% from 75% on Thursday. Commerzbank senior economists said in a note that the FOMC will likely raise rates by 75 basis points on September 21, rather than by 50 basis points, shrugging off a slowdown in August employment growth.
West Texas Intermediate futures jumped 0.6% to $87.14 a barrel. In recent weeks, crude oil demand has fallen "considerably short" of its seasonal level, and prices will likely remain under pressure in view of "substantial risks" to demand, according to a separate research note from Commerzbank.
"All three energy agencies envisage an oversupplied market in the short to medium term," Commerzbank analysts said in the note. "This is why Saudi Arabia has raised the prospect of production cuts."
In company news, Lululemon Athletica (LULU) raised its full-year guidance after beating sales and earnings expectations in the fiscal second quarter as strong demand, rather than markdowns and price promotions, continues to drive growth. Shares jumped 6.7%.
Notes on My Scorecard
August was a nightmare for investors and September is shaping up poorly as well. The only sectors or factors performing well, with tiny fractional gains, are the defensive plays in Utilities (XLU) and HealthCare (XLV).
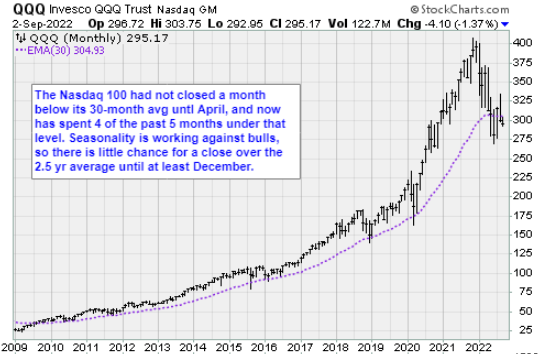
Among the major indexes, the Dow Jones Industrials are down just 0.4% this month after losing 4.2% last month; it’s still down 12.5% for the year.…Flipping around to the worst major index, the Nasdaq 100 (QQQ) is down 1.3% for the month, -6.4% for August, and -25.6% for the year.
Value (SPYV) is outpacing Growth (SPYG), with growth down 23.5% for the year vs value down 9%.…Tech (XLK) was down 7.8% in August and is -23.2% for the year. The worst sector is Communications Services (XLC), down 7.9% in August and -30.2% this year. A lot of that is Meta Platforms (META), down a whopping -52%.
Overseas, the best market is Brazil (EWZ), up 6.9% in August and 1.6% this month, as well as +15.8% for the year. … Perhaps surprisingly, the worst overseas market is Germany (EWG), down 2.5% this month; down -9.3% in August and down -32.7% for the year.
The S&P 500 has spent the last 102 sessions below its 200-day average. That’s the longest streak since the 2007-2009 great financial crisis. Bespoke Investment Group analysts riffed their database to learn how the benchmark index has done in the postwar era when the S&P 500 was below its 200-day average for more than 100 days. The answer is…not good. -2% over the next month, -3.4% after six months, and a slim +4.6% after a year.
You’re not going to like this but…according to BI research, the last instance was May 20, 2008, to June first, 2009: The return over the next month after the 100th day was -6.7%, six months was -46.7%, and twelve months was -36%. Ow!
To gain a better understanding of the forces affecting stock prices since the August 16 high, Bespoke published their famous S&P 500 factor performance grid. They discovered that growth stocks and former high flyers (aggressive valuations) are leading the market lower.
Small caps and stocks with low absolute prices are also bending performance lower. And even the best factors are pretty terrible.…The least awful, but still really bad, factor was low P/E mid-caps.
Speaking of valuations, with the S&P 500 trading at just under 20x earnings, its price/earnings multiple is currently right in the middle of its ten-year range at the 46th percentile, according to a BI study. Although the S&P 500’s multiple is in the middle of its ten-year range, at the sector level there is a ton of dispersion: Energy, Financials, Health Care, Materials, and Real Estate are all trading in the lower decile of their ten-year range while Consumer Discretionary, Industrials, Technology, and Utilities are all still expensive relative to their ten-year range.
These kinds of divergences are usually resolved when the most expensive get cheaper (not when the cheaper become more expensive.
Strategic Portfolio
Daily Results: Our Digital Transformation list declined by 1.1% on Friday.…We added Netflix (NFLX) shares back into our list at $208.17 on July 20. Set stop at $215.20....Our Tesla (TSLA) stopped out at $279.
Our Other Letters: In our Tactical Options letter today we banged out a 60% overall gain on a two-day position in Qualcomm (QCOM) puts, which was awesome.…Last week we enjoyed a great 40% return on Etsy (ETSY) September $100 puts….In our Counterpoint Options newsletter, we sold positions in S&P Biotech SPDR (XBI) August $85 calls for an overall gain of 60%.


